I have been guided by Clara that the literature review process should seek to provide three different kinds of information
- Foundational Knowledge: This is should be about the core concepts/themes of my dissertation. I can quote papers without needing to do much critical analysis, unless if my dissertation aims to challenge the core itself.
- Establishing Gaps: This is where I quote the papers because I am poking holes at their methods/arguments/results. My dissertation should roughly be about 'why this paper/these papers is/are wrong/incomplete'
- Parallel Research: This could be the same papers I use to establish gaps, it could be different. But the point of papers in this category is to provide justification for the methods that I end up using in my dissertation
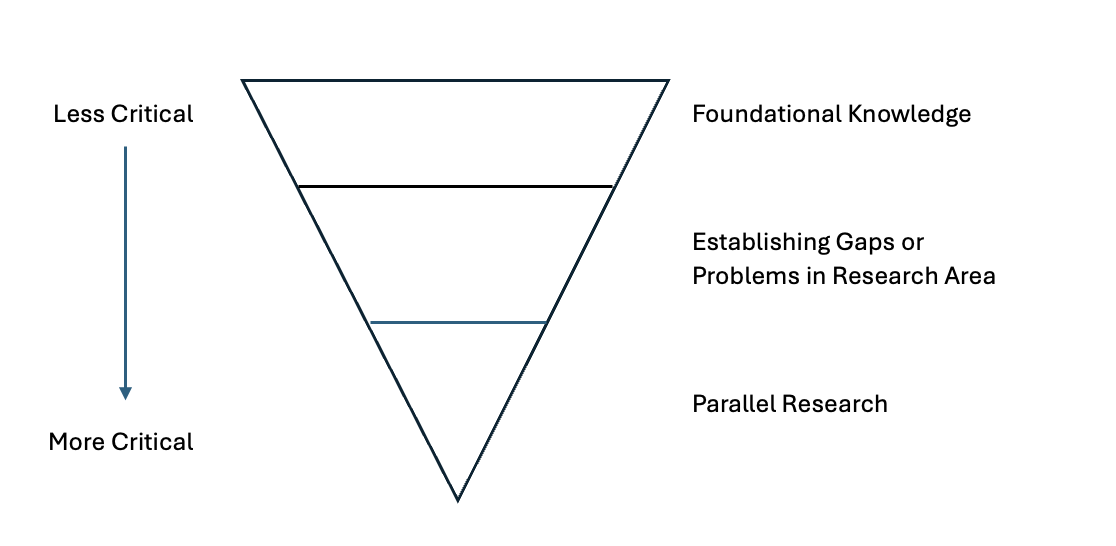 One of the slides that Clara shared with us to explain about the different kinds of information to look out for when doing a literature review
Based on my most recent rambling, I am facing critical issues with selection of SIM type and what principles
should I rely on to guide my editing of GTFS in order to simulate different improvement scenarios -- this would be about Parallel Research.
Additionally, I have not developed a full and thorough case for shifting the debate about accessibility to one based on OD data and predicted demand
from SIM instead of just 'total number of people/total number of opportunities accessibile' -- this would be about Establishing Gaps.
Lastly, I need to build a case on whether I should frame my dissertation as a matter of 'injustice' or just 'inequality', which I can do if I go for
papers that can inform me about Foundational Knowledge.
I would have wanted to separate into different subpages for each of the three information kinds and summarise each literature that falls into each
category, but after four days of plowing through some of the literature, I felt that a lot of the sources overlap in the information type that they
provide, espectially between 'Establishing Gaps' and 'Parallel Research'. So I am going to have just one long page of literature summaries here with
a table listing down how I roughly classify each source, while the implications on my project will be summarised in the
Context page instead.
Classification of Literature
Click on any of the titles below to get the summary. Links to the original articles are also provided!
Foundational Knowledge
Accessibility and transport appraisal: Approaches and limitationsA family of accessibility measures derived from spatial interaction principles
Establishing Gaps
Assessing public transport infrastructure: The role of employment matching in spatial accessibility measuresFuture accessibility impacts of transport policy scenarios: Equity and sensitivity to travel time thresholds for Bus Rapid Transit expansion in Rio de Janeiro
Parallel Research
Public transport accessibility indicators to urban and regional services in Great Britainrt2gtfs: A scalable framework for correcting public transport timetables using real-time data for accessibility analysis
Simulating the effect of stratgeies to increase transit ridership by reallocating bus service: Two case studies
Assessing public transport infrastructure: The role of employment matching in spatial accessibility measures (Link)
What Is It About: It is a paper that addresses how we define accessibility from a place to job opportunities. It contended that prior research use a broad definition of accessibility to jobs by assuming that everyone is eligible for every job everywhere. So the researchers decided to compare between this broad definition of job accessibility (how easy for people in this place to get to jobs in general) and a narrower definition where the job accessibility is bounded by the educational levels of population at origins and suitable types of employment at destinations (how easy for people in this place to get to jobs that they are eligible for) at different geographical units (introducing MAUP into the research).My Takeaways: I was highlighted by Claude that this paper uses SIM, but it is quite limited in the sense that it uses a doubly-constrained SIM to define the cost function, which in turn is used in the accessibility formula - the core thing that the research is about. However, their accessibility formula is essentially the sum of all destination weights multiplied by the cost function. I could flip this around to find the accessibility of a place by people from everywhere else -- the sum of all origin weights multiplied by the cost function -- and this could be the 'accessibility metric' that Claude may have been suggesting to me all along (I'm still not sure HAHAH)... but I need to find more papers that does this 'accessibility metric' the other way around.
Public transport accessibility indicators to urban and regional services in Great Britain (Link)
What Is It About: It is a paper that documents HOW they created the travel time matrices between all LSOAs/Data Zone (DZ) in England, Wales and Scotland using scheduled GTFS data, and then crunching out the numbers on how many urban/regional services are within several journey thresholds from each origin LSOA/DZ. They intend for this to lower the barriers for other researchers, especially those outside of the transport field who may not be familiar with public transport timetabling standards or coding, to look into accessibility at a granular level across Great Britain.My Takeaways: Considering how I have snapped the city centre boundaries the LSOA, and how I decided to set origins to LSOA population centroids, I have further justification to cut down on processing time on r5py by setting BOTH origins AND destinations based on the LSOA population centroids before getting the median travel time from MSOAs to the city centres. However, I am cognisant that it introduces walking egresses before AND after the public transport leg/s, and I need to ensure that r5py only models 'reasonable journeys' -- the walking time does not exceed 10/16 minutes based on the public transport stop that one go to/came from.
rt2gtfs: A scalable framework for correcting public transport timetables using real-time data for accessibility analysis (Link)
What Is It About: It is a paper that documents HOW they created a different way to generate retrospective GTFS data from GTFS-RT that is released by UK BODS, slightly different from Open Innovation's code and how I have adapted it so far. Unlike Open Innovations, which did not provide much in way of technical report and citations informing about the principles behind their code (which is fair, they are not an academic outfit, they are a think-tank), this paper defended their method by adapting it from Wessel et al. (2017). That is a paper that I am well aware of since my undergrad because one of the co-authors is none other than Jeff Allen, my direct supervisor back in UofT School of Cities 🤣, and there were initial plans of wanting to map out the actual-vs-scheduled accessibility of public transport in Toronto back when I was still working there, but it was a side project...My Takeaways: Very useful, the researchers actually put up a public GitHub repository where I can use the code. As of now, there are two main ways in which this code is different from Open Innovations' code. Firstly, this code ONLY uses real-time trip_id data that can be matched with scheduled trip_id data, reducing code complexity and running processes. However, to reduce excessive data filtering, they do require a week's worth of scheduled GTFS data to facilitate that trip_id matching instead of just the day that corresponds with the GTFS-RT data. At this point, I am inclined to switch over to using this code instead of Open Innovations' code because this code is accompanied by a full technical report. Further changes to how I eventually generate the retrospective GTFS will be updated at this page! Additionally, this also introduced the concepts of 'Travel Time Inaccuracy', 'Travel Time Uncertainty' and 'Travel Time Variability', which is important at the conceptual level.
Future accessibility impacts of transport policy scenarios: Equity and sensitivity to travel time thresholds for Bus Rapid Transit expansion in Rio de Janeiro (Link)
What Is It About: It is a paper that assesses the potential accessibility impacts to jobs across Rio de Janeiro if the BRT expansion projects -- initially planned for Rio 2026 Olympics but did not complete in time -- were to come to fruition, either fully or partially. It relies on official documents on the planned BRT routes (and also which redundant bus services would be cut once BRT is operational) to modify scheduled GTFS data in order to simulate the impacts of partial or full BRT implementation on job accessibility. It measures job accessibility based on 'cumulative opportunity measures' -- how many jobs are available within the area that one could travel within a threshold time. They tested multiple thresholds in order to see how the metric changes.My Takeaways: Two main takeaways that I got. Firstly, it indicated from official documents that when the BRT services are in operation, redundant services would be cut. It is indicative of how some transport operators make the tradeoff of forgoing some services to accommodate new ones. Hence, for my dissertation, if I want to have a realistic implementation of 'increasing bus frequency' scenario, I also need to factor in how other services may need to be cut. (But we will think about it later...) Second takeaway is that this paper is upfront that it uses cumulative opportunity measures as their metric, which they acknowledged that, while simple, it is not the most realistic situation (all job opportunities are treated as equally desirable, does not account for actual travel patterns) and also dependent on the threshold selected for time travel. I can make it clear that I avoid their pitfalls when I do SIM to model the various improvement scenarios because it accounts for where people actually go for work and that it is threshold-independent.
Simulating the effect of stratgeies to increase transit ridership by reallocating bus service: Two case studies (Link)
What Is It About: This is actually an agent-based modelling paper that is used to model how commuting patterns change in two US cities based on three scenarios -- 1) what if bus frequencies to low-income areas are increased, 2) what if bus frequencies to high ridership areas are increased, 3) what if we do scenario 2 PLUS reduced travel times from exclusive bus lane implementation.My Takeaways: What is interesting is that they made it clear that they wanted to maintain the total vehicle revenue miles (VRM) constant. So increasing frequencies for scenarios 1 and 2 resulted in reduced frequencies for every other route, but only up to the level that would keep VRM the same. I could consider doing this when exploring more realistic scenarios of increasing frequencies for my dissertation (see my takeaway on this reading), including the cutting of bus frequencies elsewhere, but I am cognisant that this would dramatically increase the complexity of my project, so we shall see! I am also motivated to find for articles that discusses the role of VRM in public transport operations -- is it a big factor of operational costs of running buses, and is this a factor just for the US or in the UK too?
Accessibility and transport appraisal: Approaches and limitations (Link)
What Is It About: It is a working paper that reviews how researchers have measured accessibility and conducted transport appraisal studies. It covers at length about the different metrics that researchers have used, which, while can be summarised into the four categories that the paper used, can also be summarised into four other types -- general catch-all accessibility, accessibility assuming competing destinations, accessibility weighted by travel time, and welfare utility as understood in economics.My Takeaways: By virtue of how I started this project, the accessibility metrics most relevant to me would be the accessibility weighted by travel time, but flipping it instead to look at potential accessibility to a destination instead of potential accessibility from an origin (this is what this reading did). I also find this reading to have useful criticisms about the limitation of current appraisal methods, chiefly that it is very short term and not as all-encompassing as a proper Land Use-Transport Interaction (LUTI) model. This same criticism will also apply to my dissertation!
A family of accessibility measures derived from spatial interaction principles (Link)
What Is It About: It is a paper that proposes an updated family of Hansen-style accessibility measures that incorporates SIM principles in order to increase interpretability. Original Hansen accessibility outputs are unitless so you cannot say 'Origin 1 has reasonable access to about 50 jobs'. However, their proposed additional measures can do that because they apply the constraining principles from SIM, further tying the Hansen accessibility measures and Wilson's SIM closer.My Takeaways: The additional measures are actually not that useful since I am using Locomizer data that I already do not trust the actual numbers and I am only going to report percentage changes between improvement scenarios and the baseline situation. What is useful is that this is the first authoritative report that shows Hansen accessibility can be used for the other way (plus this article too), so I can justify reporting that "destination-potential accessibility to city centre has improved by XX% based on this scenario". Nevertheless, I can also highlight in the discussion section that in the future, with presence of better OD data, one can use these new accessibility metrics to provide more interpretable numbers to policymakers/transport planners about how each transport improvement scenario affects accessibility from/to a certain area/facility.
Meanwhile, the following are the list of things that I have found but have not read so I need to read and then decide if it is useful or not for the literature review!
- Evaluating real-time and scheduled public transport data: Challenges and Opportunities
- The geography of inequalities in access to healthcare across England: The role of bus travel time variability
- Improving mass transit operations by using AVL-based systems: A survey
- Bus-arrival-time prediction models: Link-based and section-based
- Modelling transit trip time using archived bus dispatch system data
- Modeling the commute mode share of transit using continuous accessibility of jobs
- Evaluating the impact of public transport travel time inaccuracy and variability on socio-spatial inequalities in accessibility
- Temporal variability in transit-based accessibility to supermarkets
- Acessibility evaluation of land-use and transport strategies: Review and research directions
- Public transport accessibility accounting for level of service and competition for urban opportunities: An equity analysis for education in Santiago de Chile
- Understanding the interplay between public transport travel time variability and jobs competition on accessibility inequalities
- Causal analysis of bus travel time reliability in Birmingham, UK
- Analyzing transit service reliability using detailed data from automatic vehicular locator systems
- Understanding the impacts of a combination of service improvement strategies on bus running time and passenger's perception
- Using GTFS-data to calculate the roadwork caused delays on public transport network
- Signals, tracks, and trams: Public transport signal priority impact on job accessibility over time
- Using GTFS to calculate travel time savings potential of bus preferential treatments
- Metro 3 in Brussels under undertainty: Scenario-based public transport accessibility analysis
- Accounting for uncertainty and variation in accessibility metrics fro public transport sketch planning