June 5, 2026
Since I have been flip-flopping on which administrative boundaries that I will be using for my dissertation, I think it is about time that I should
clarify what is going on, now that I have firmed up on the choice of OD data.
Lowest-Level Administrative Geography
Since the Locomizer dataset provides Origin-Destination pair flows at the 2021 MSOA level, I will be using 2021 MSOA boundaries for the base unit of my analysis. This means that when looking at how the commuting patterns will change due to service improvements, it will be based on changes at 2021 MSOA level.City Centre Boundaries
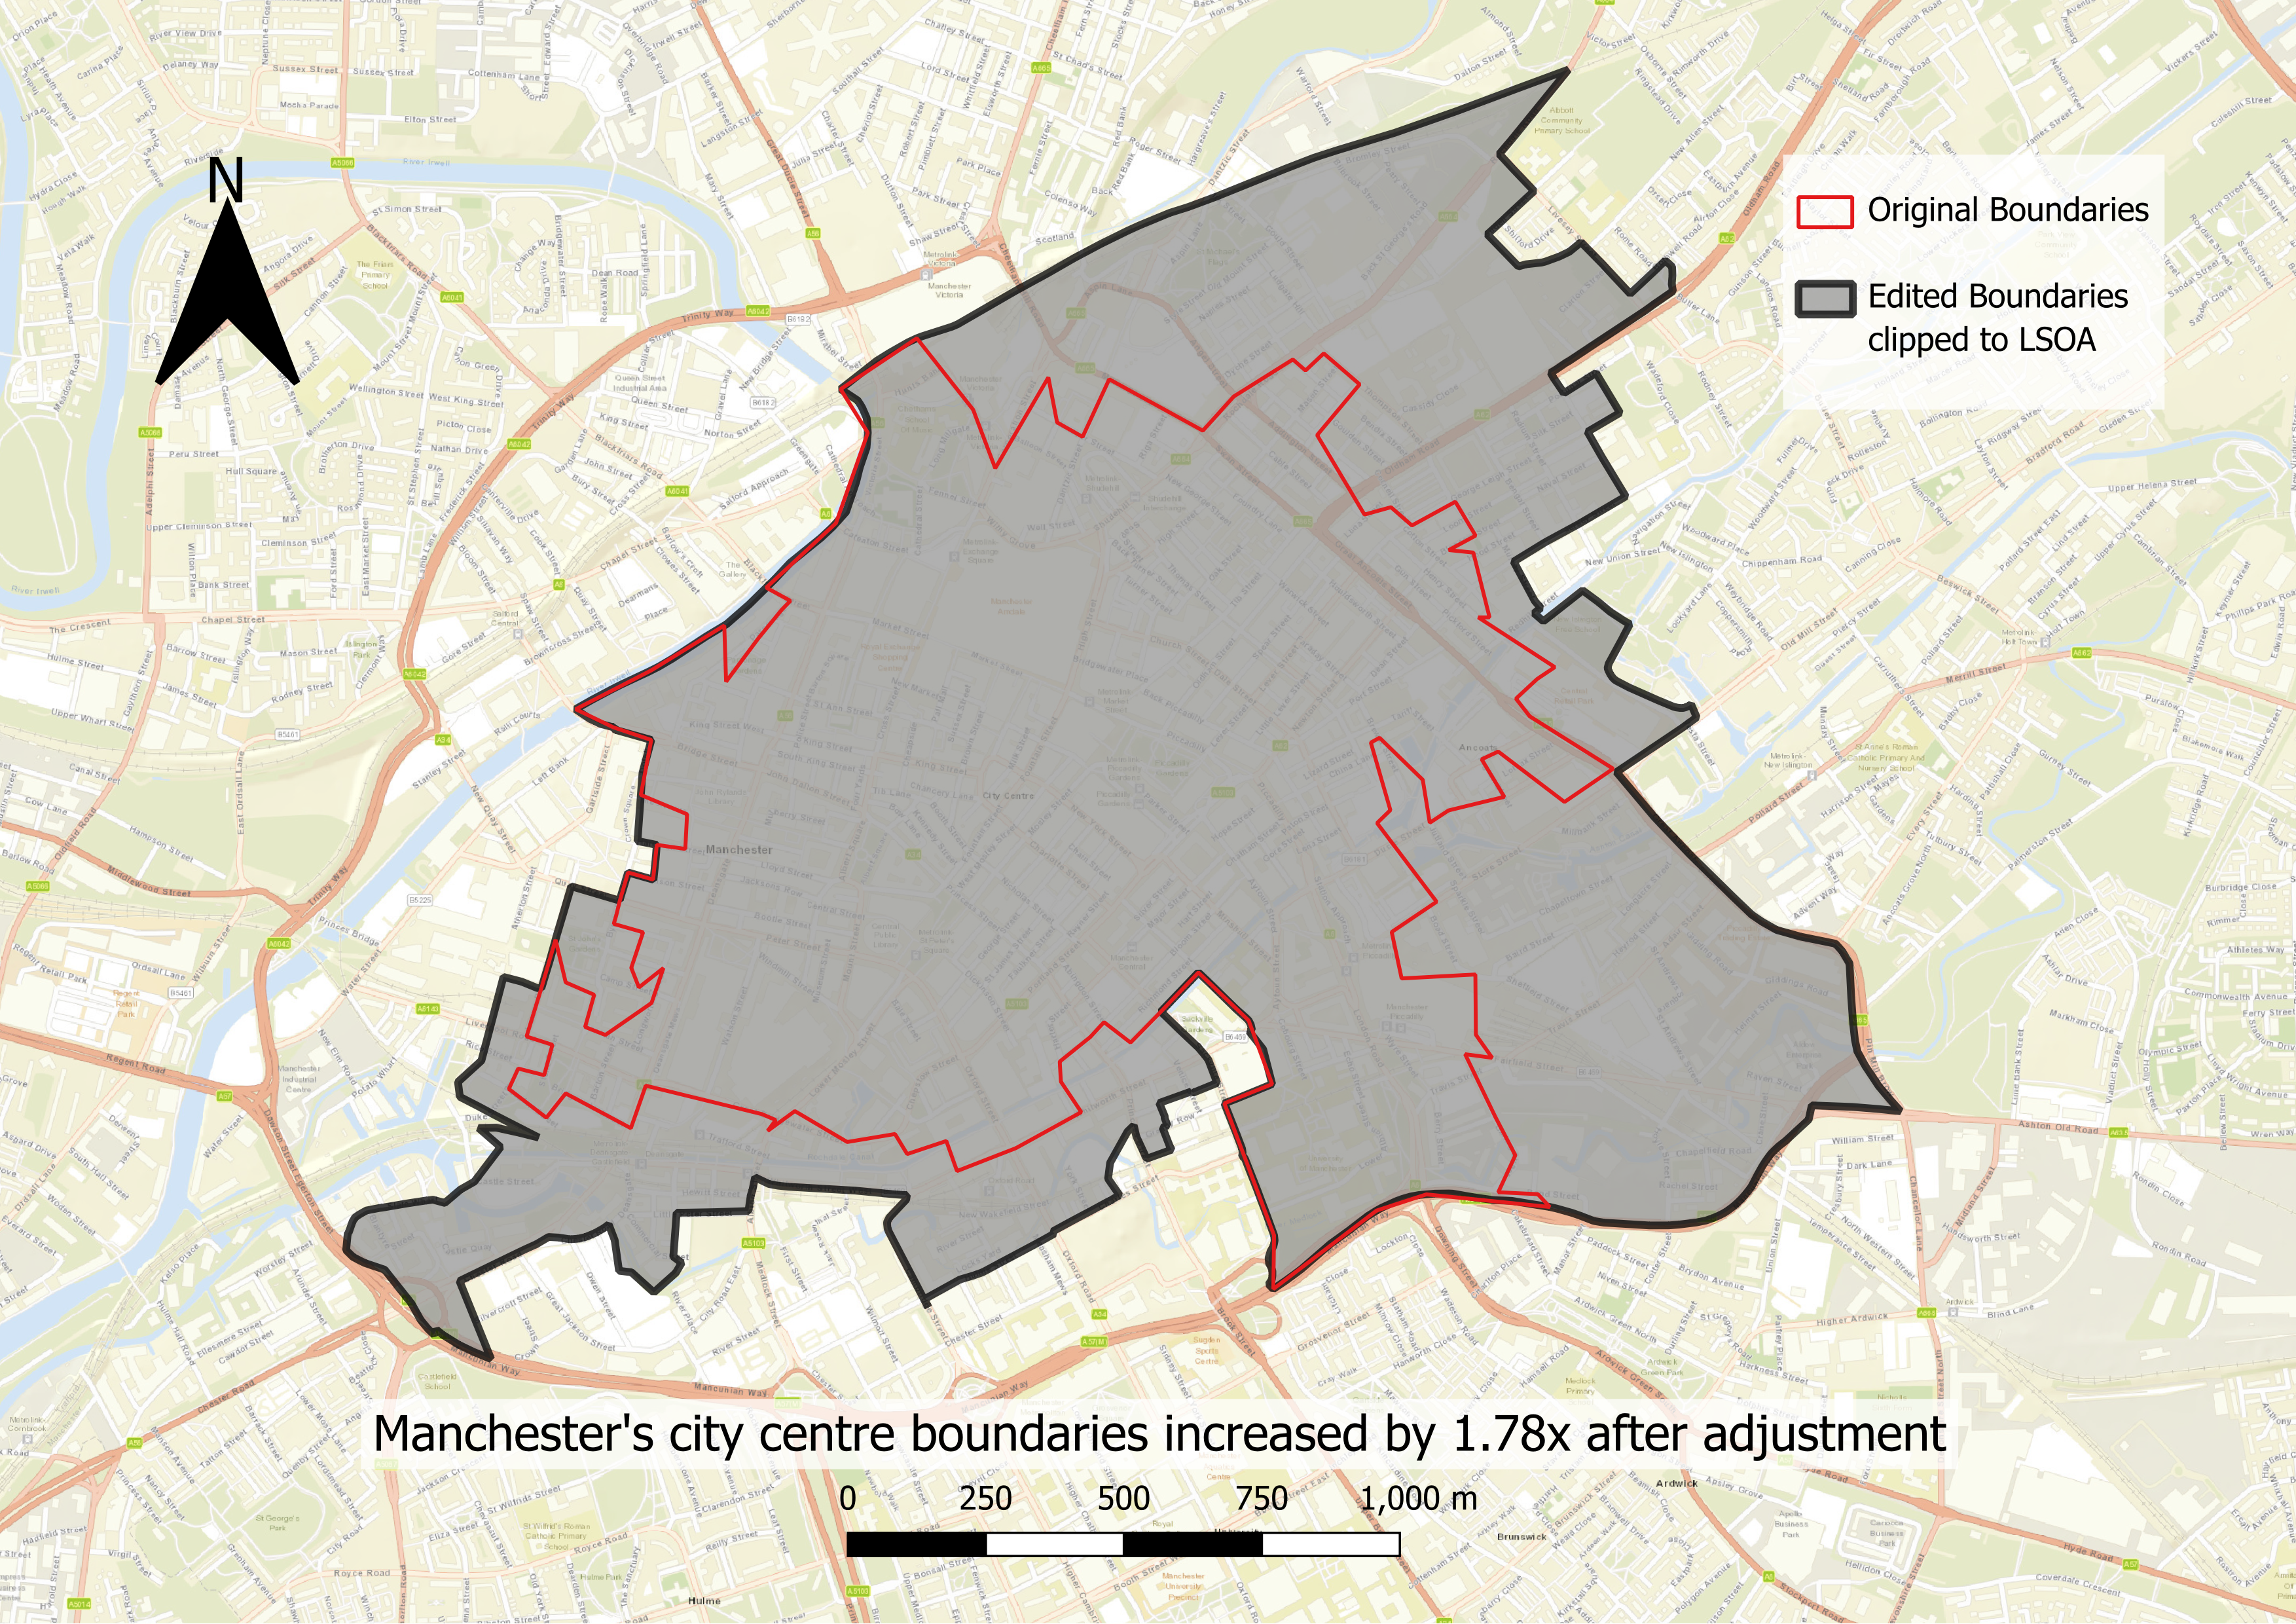
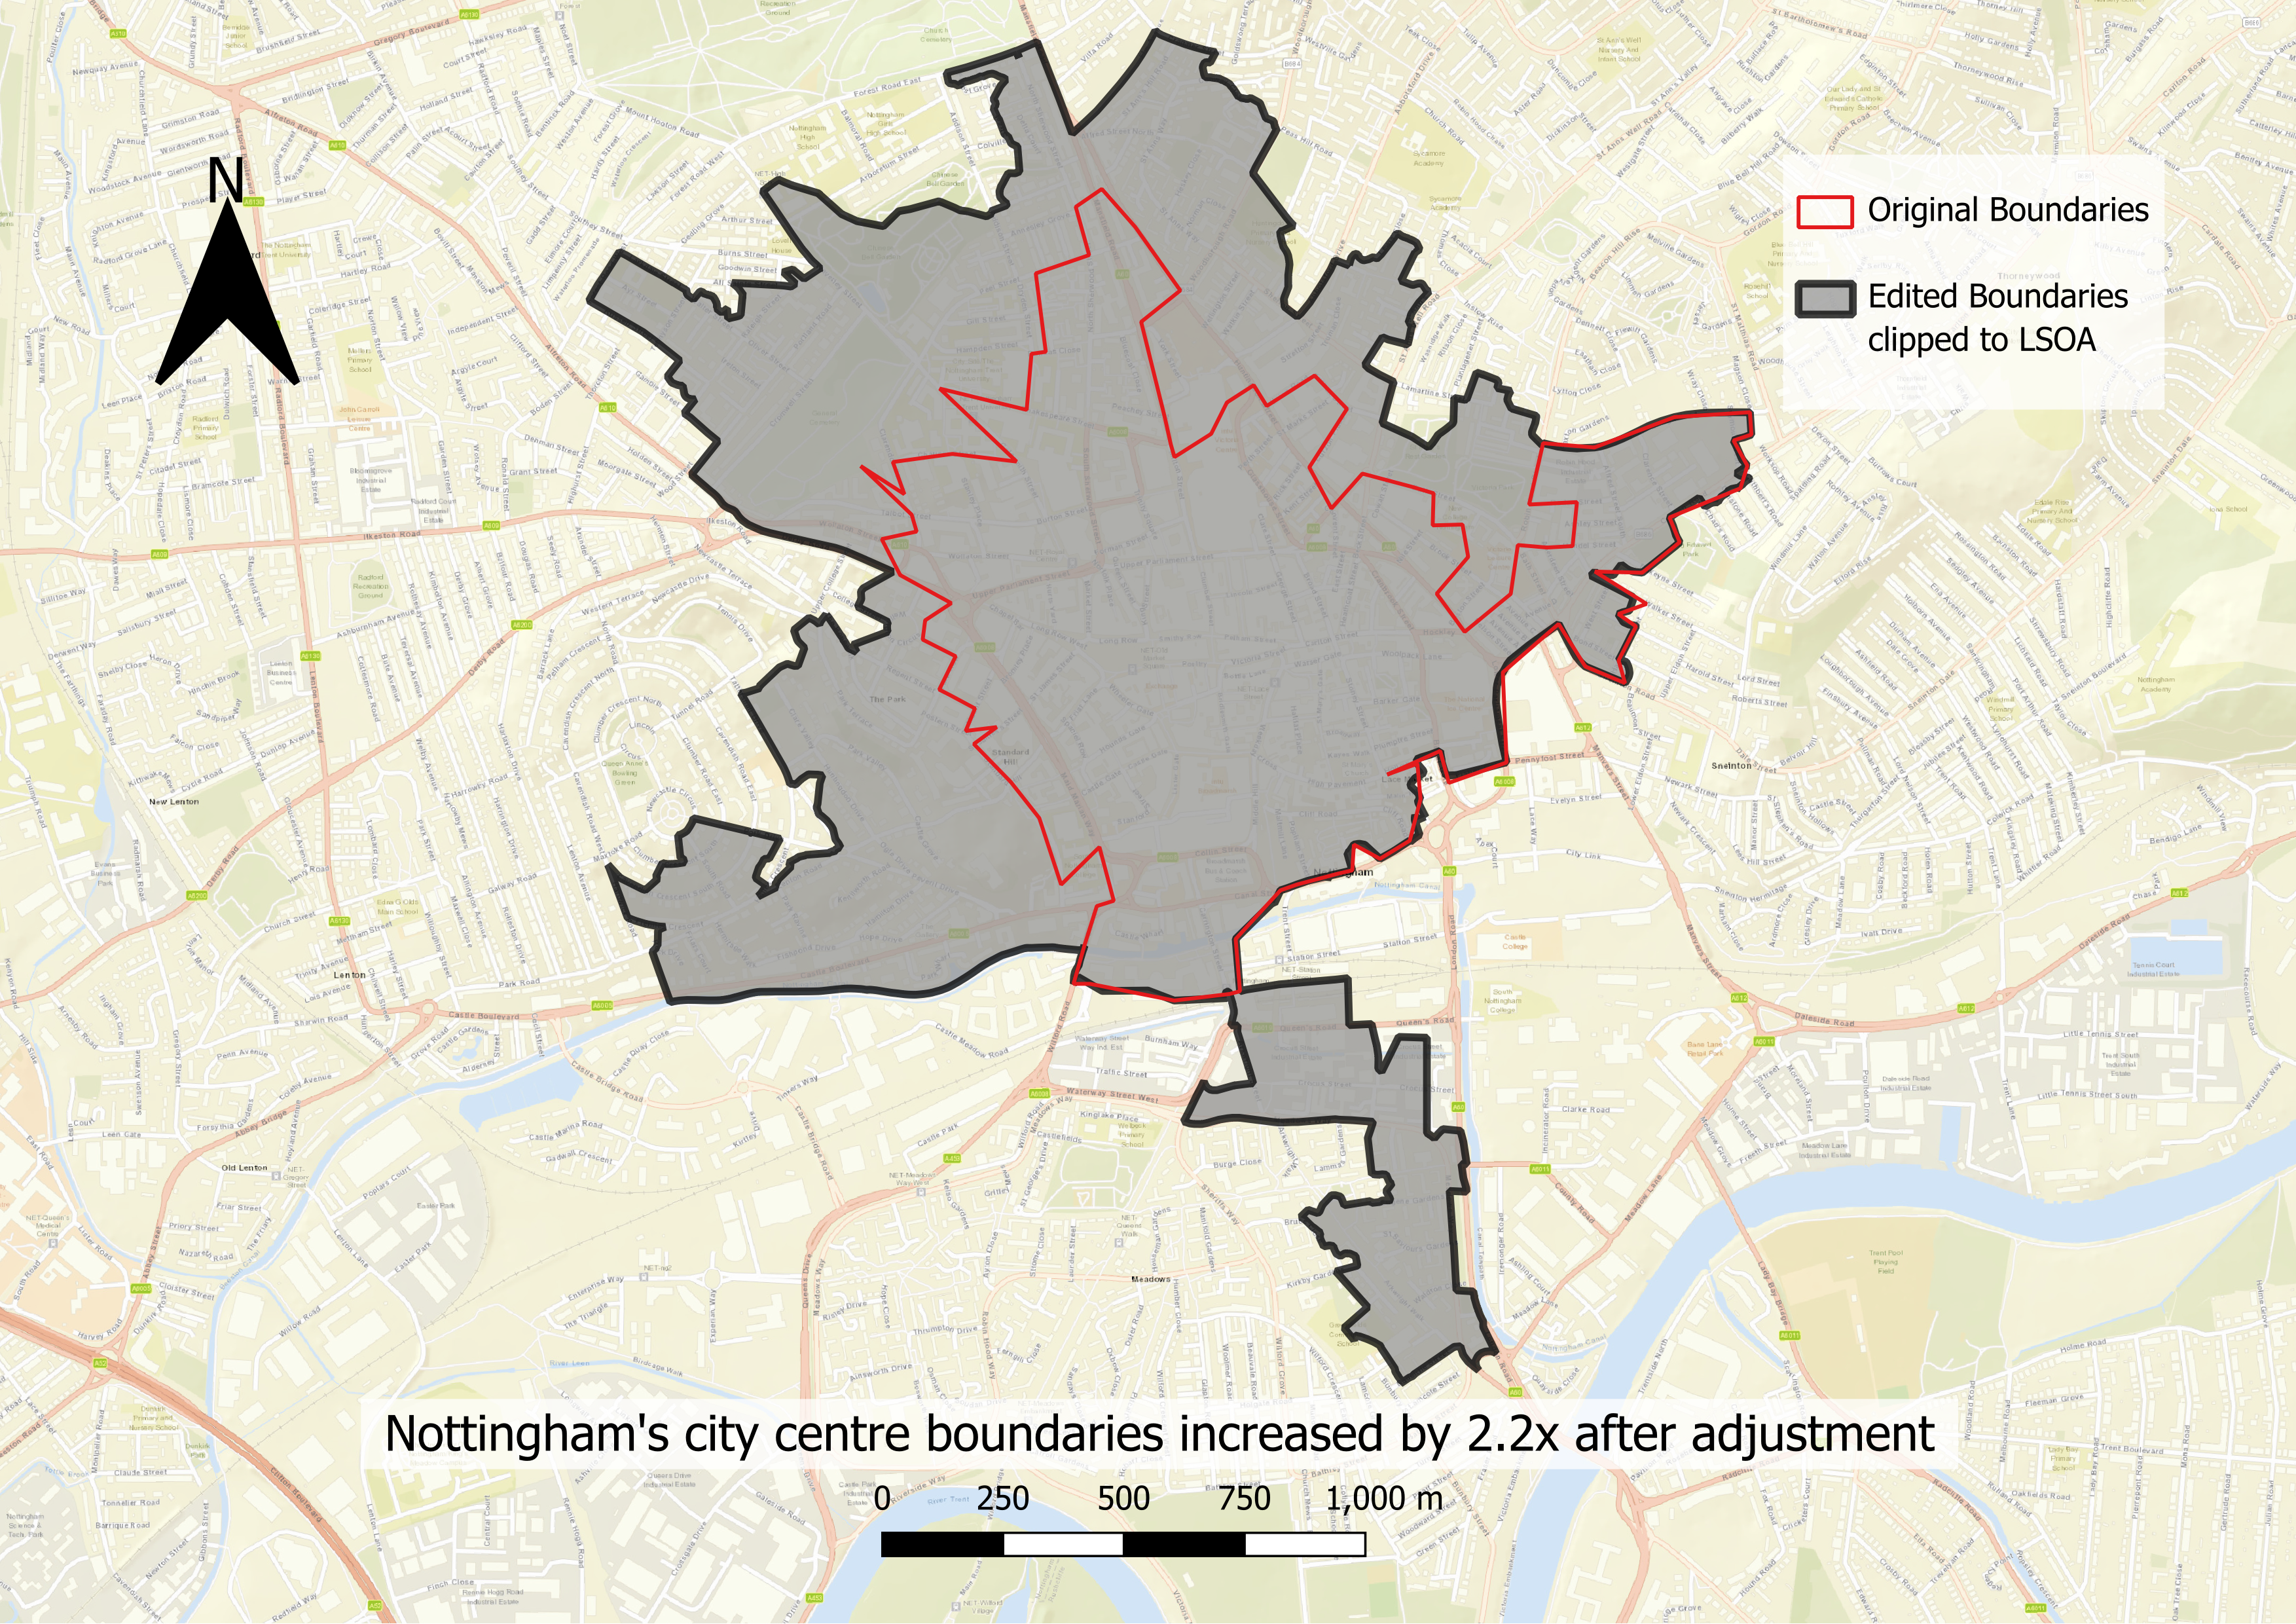
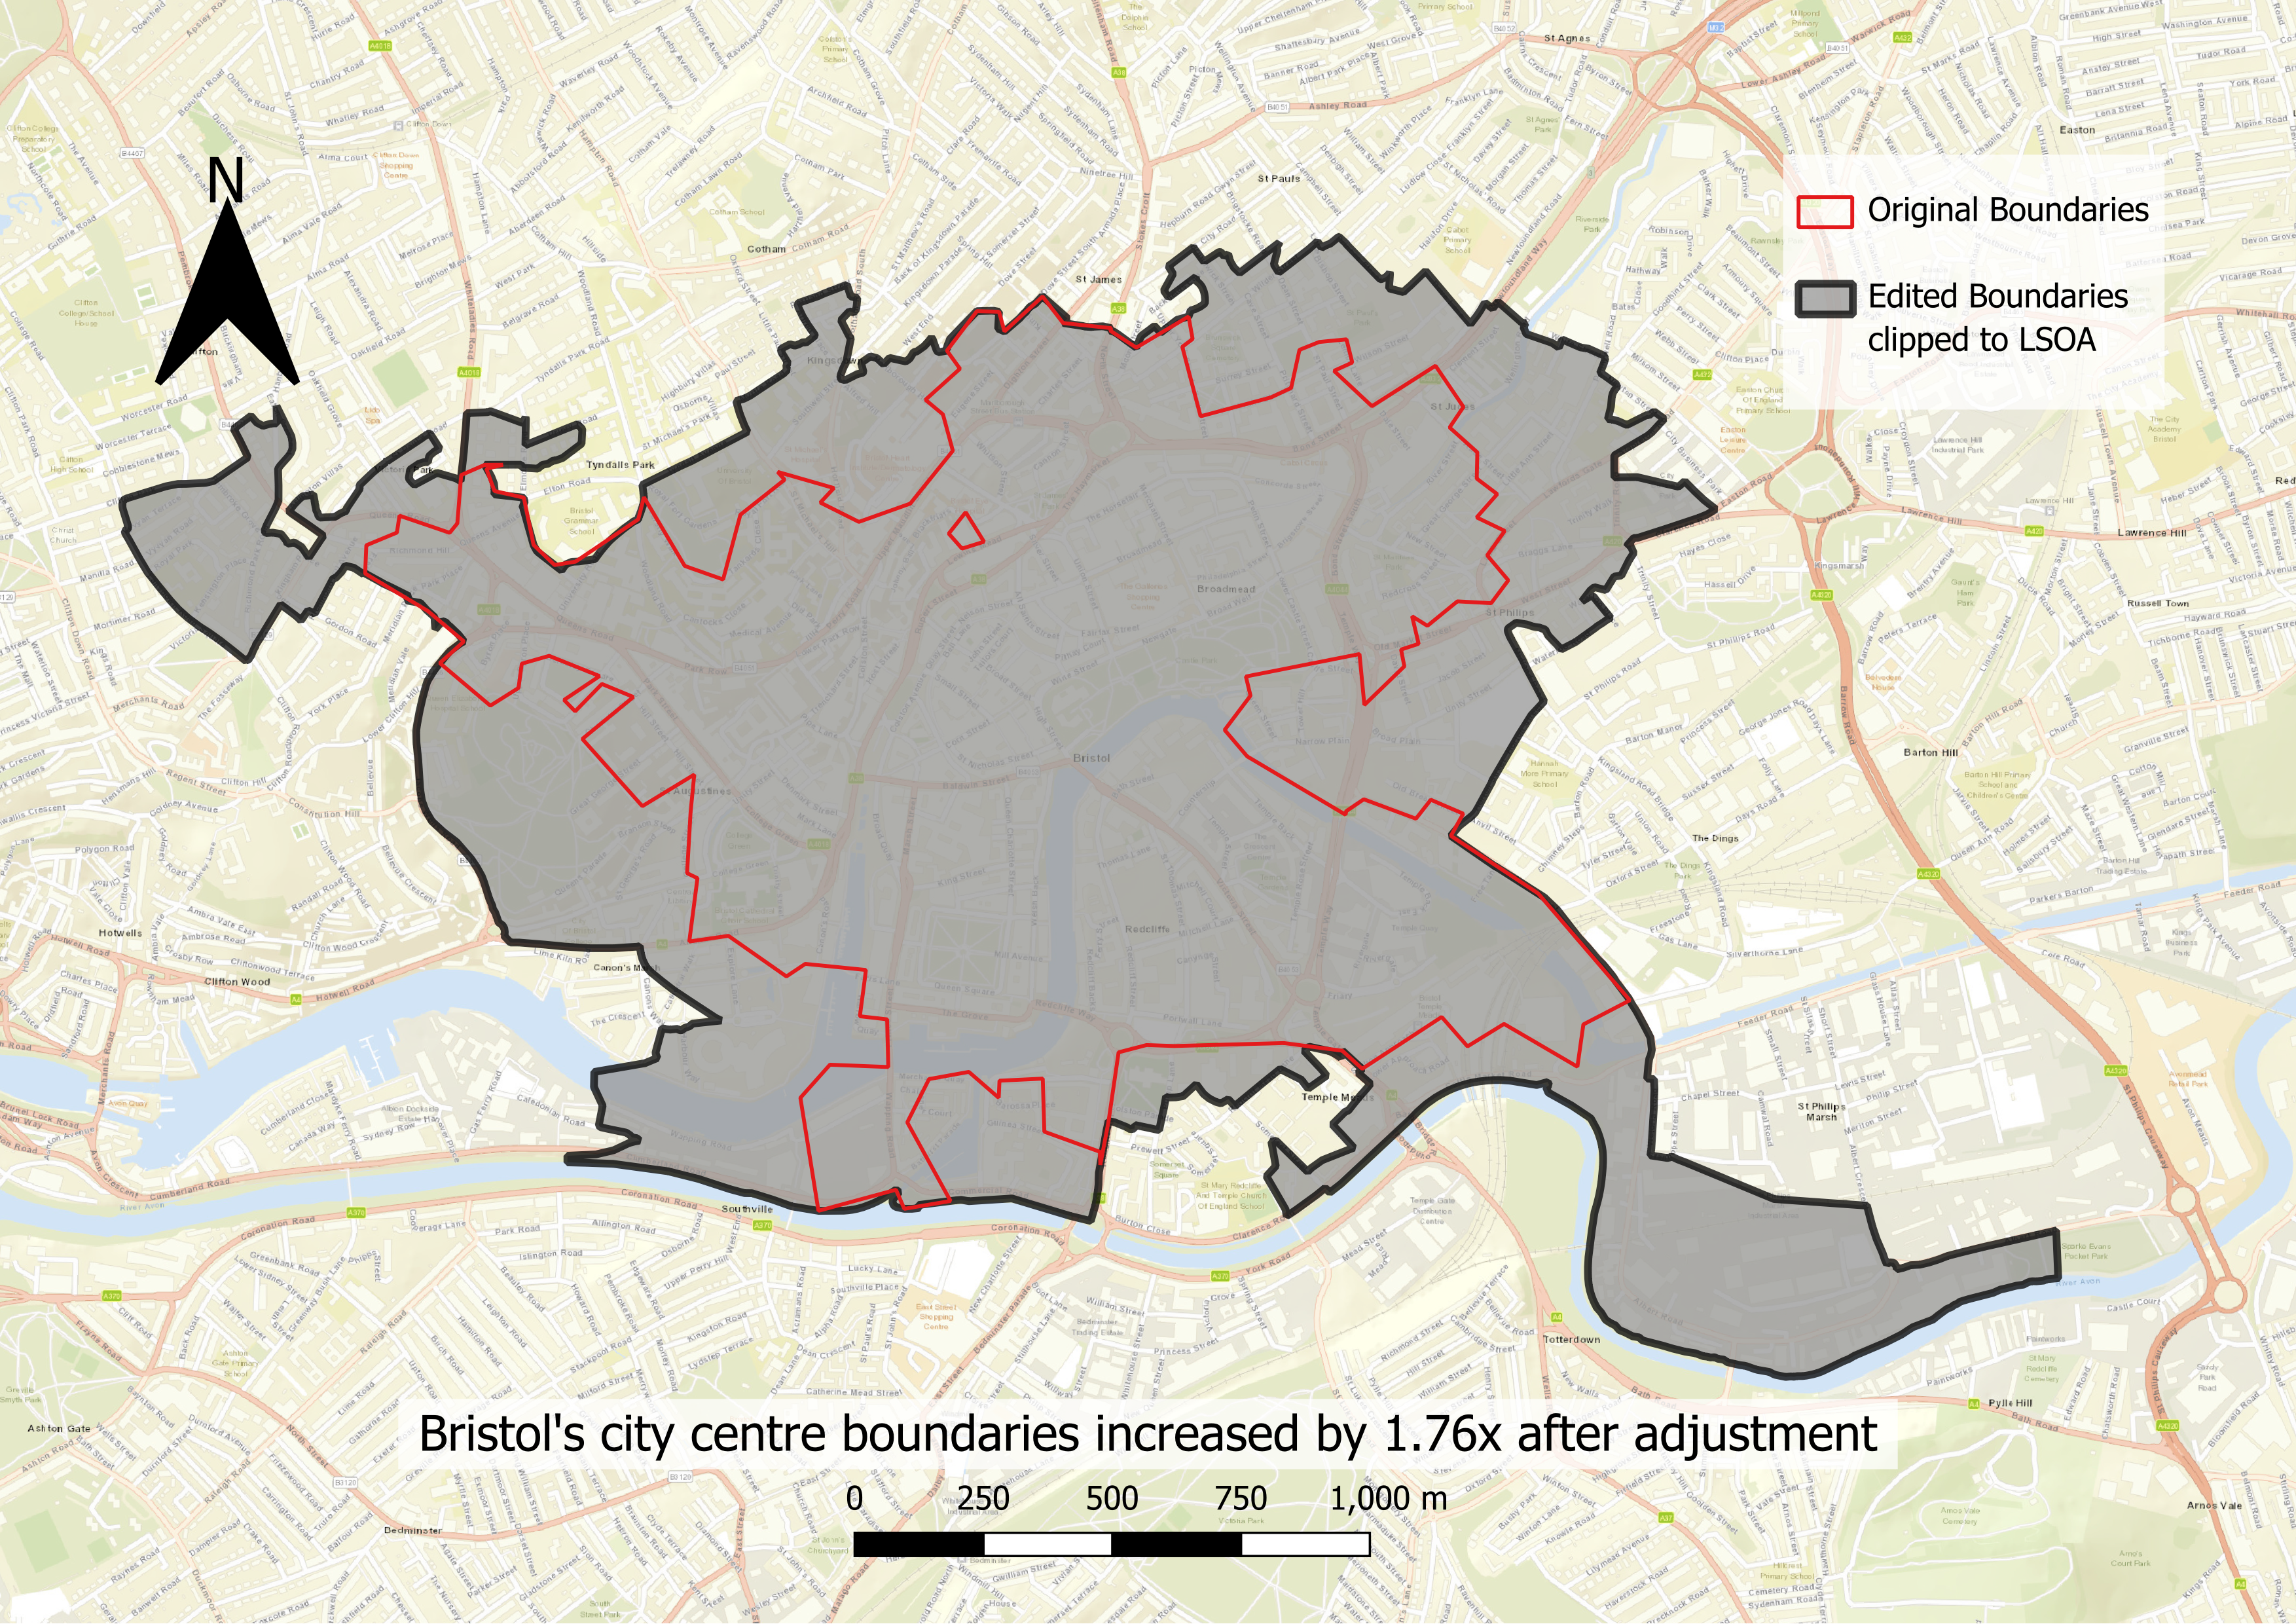
Currently, CfC defined their city centre boundaries based on another report published by CfC in 2025 which looked at high streets' economic performance across the UK. Essentially, they used a dataset of retail centre boundaries from Geographic Data Service (GoeDS) (because city centres are also retail centres) and overlaid it onto Workplace Zones (WZ). They then relied on their 'in-house knowledge of these city centres' to determine which other WZs should be grouped together into the central business district (and therefore the city centre) for the primary urban area. This is because GeoDS dataset only looks at retail centres, but CBDs also include offices for tertiary industries.Herein lies the problem - the CfC's city centre boundaries, as I got them, do not match MSOA boundaries. Looking at Manchester's city centre boundaries alone, they span across four MSOAs. For the first part of my dissertation that looks at scheduled-vs-actual accessibility, this would not be a problem. It is problematic for the second part that uses SIM to predict changes in commuting patterns because my OD data is set to MSOA level.
So this is how I intend to resolve it. Firstly, I need to adjust CfC's city centre boundaries into the 2021 LSOA boundaries. The impact is that the city centre boundaries are going to get slightly bigger. This will facilitate the usage of the latest data from Business Register and Employment Survey, which the ONS releases at LSOA and MSOA levels. I can then figure out the ratio of jobs within the updated city centre boundaries out of total jobs for each of the intersecting MSOAs. I can split the OD data accordingly based on that ratio, which would not be an issue for the OD dataset because it records flows from home to work commutes only, all other commutes have been filtered out.
1 / 3
Study Area Boundaries
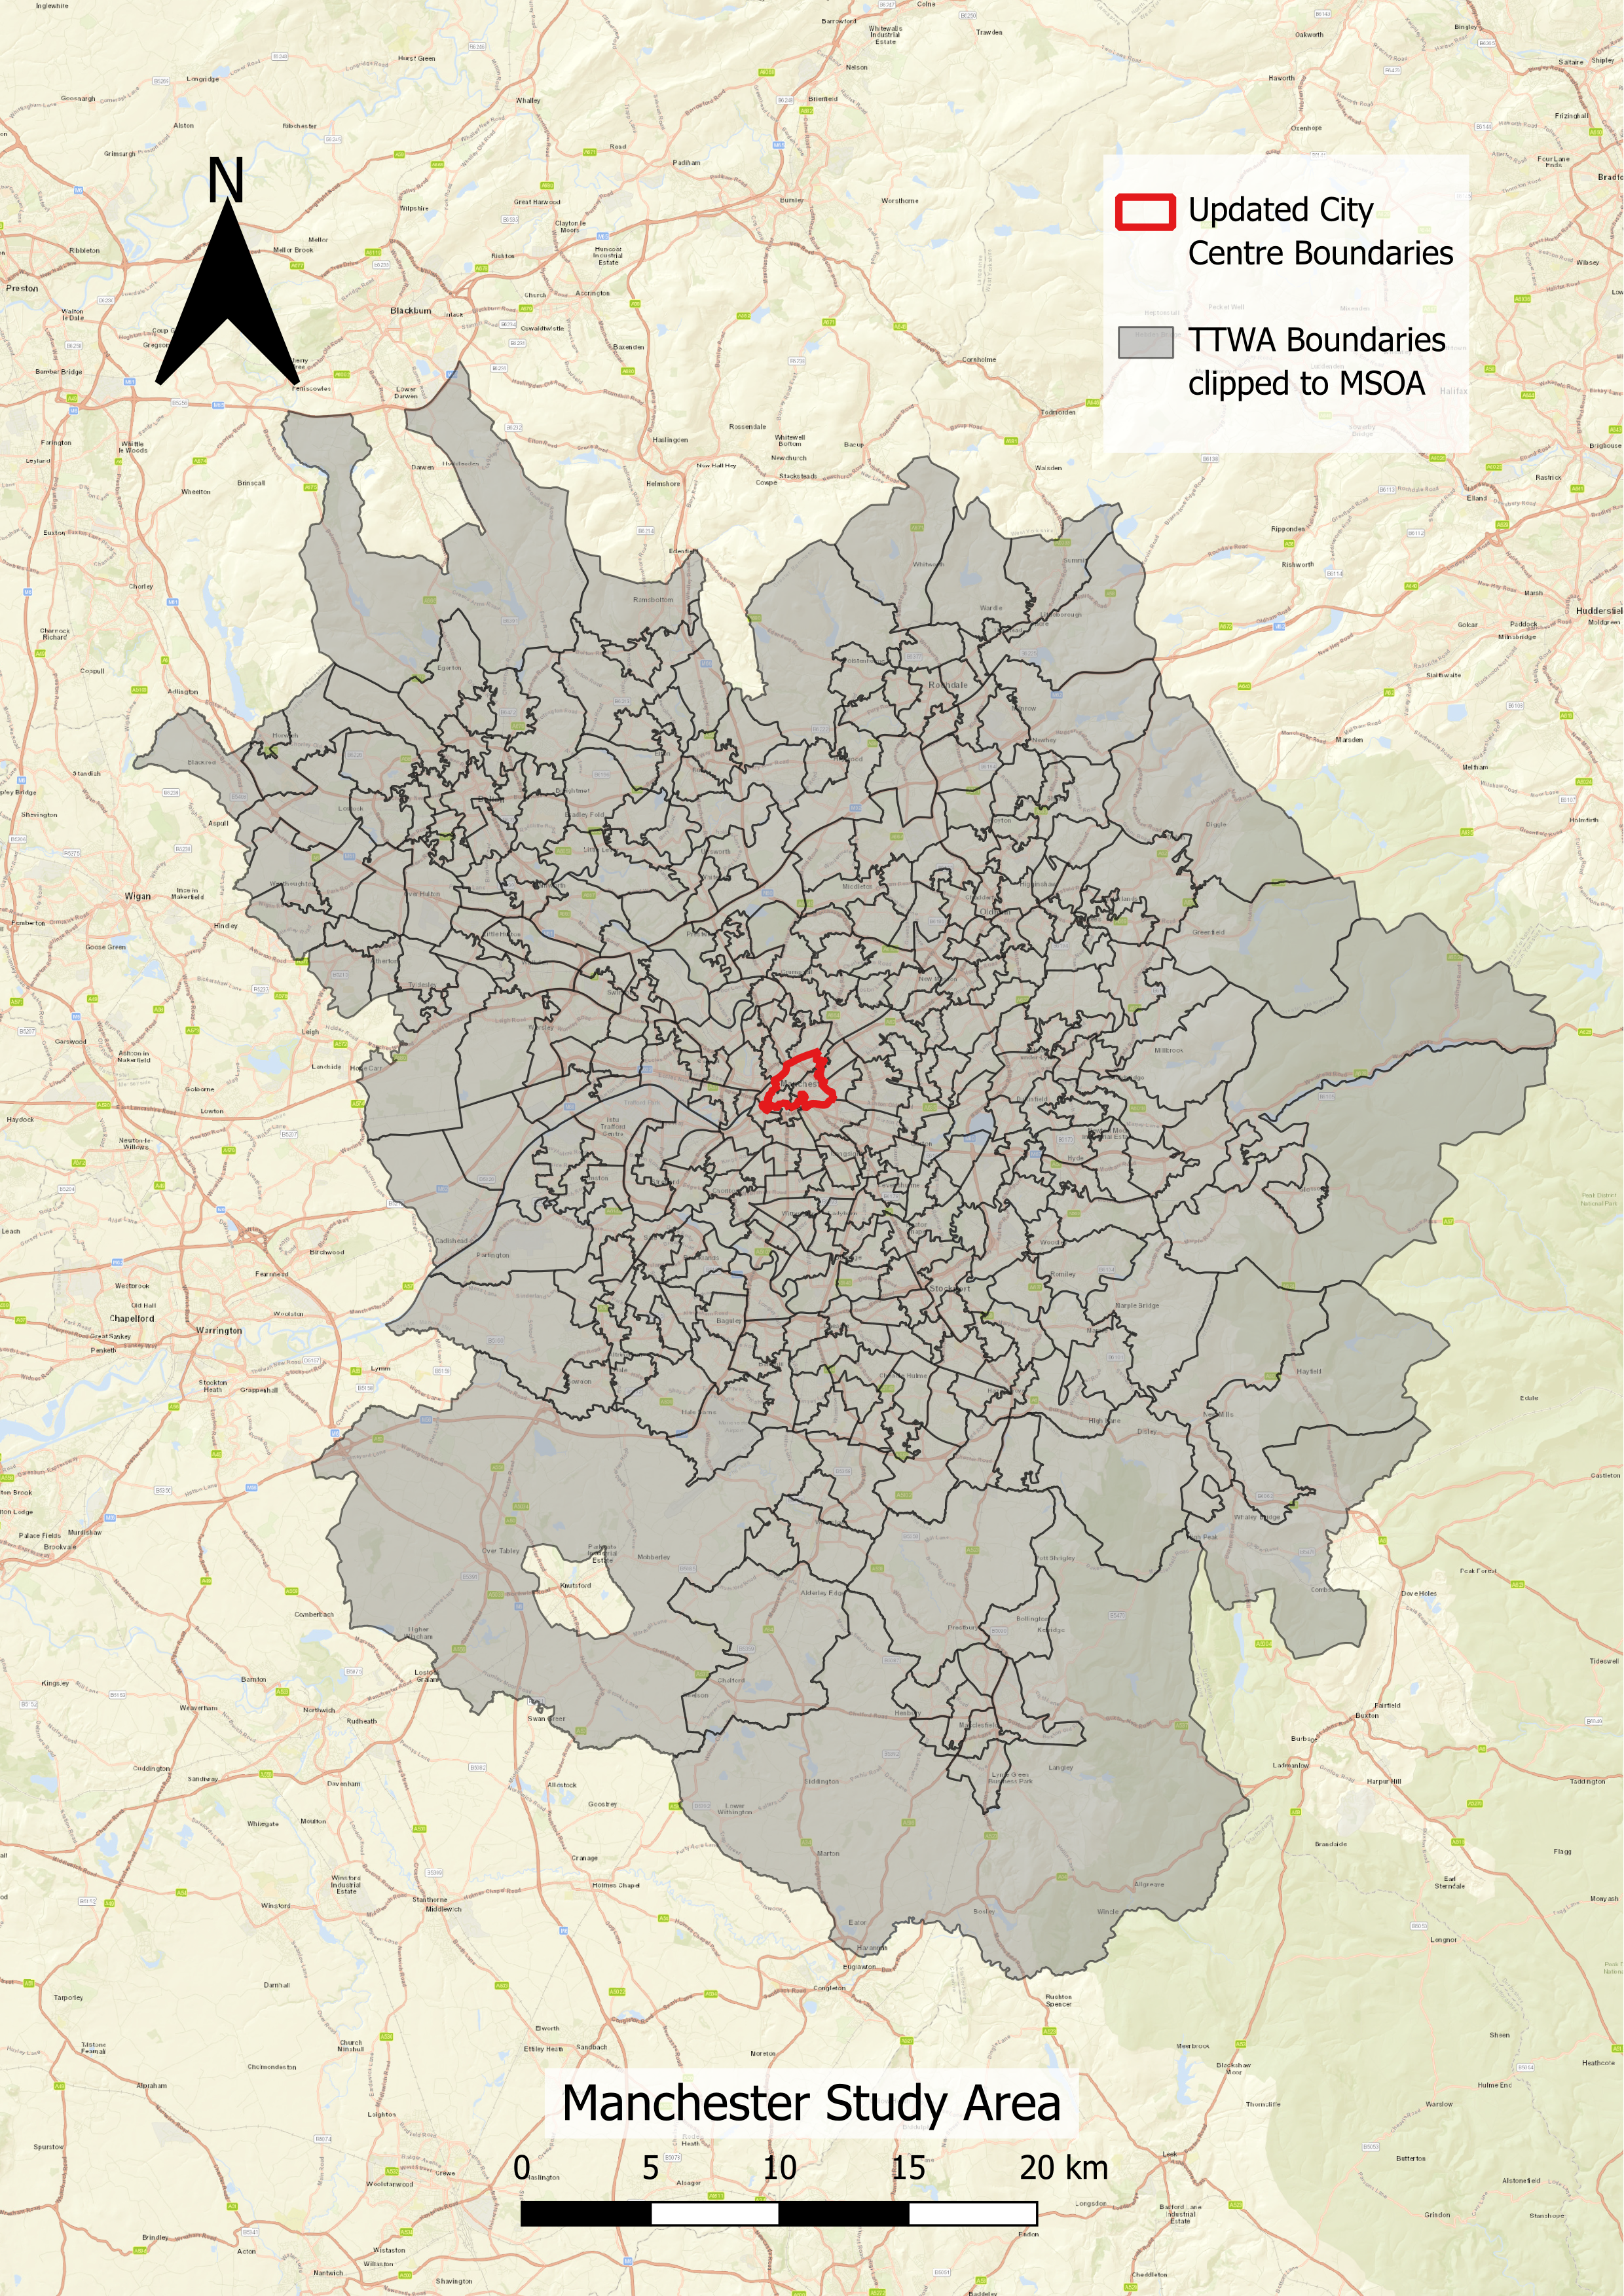
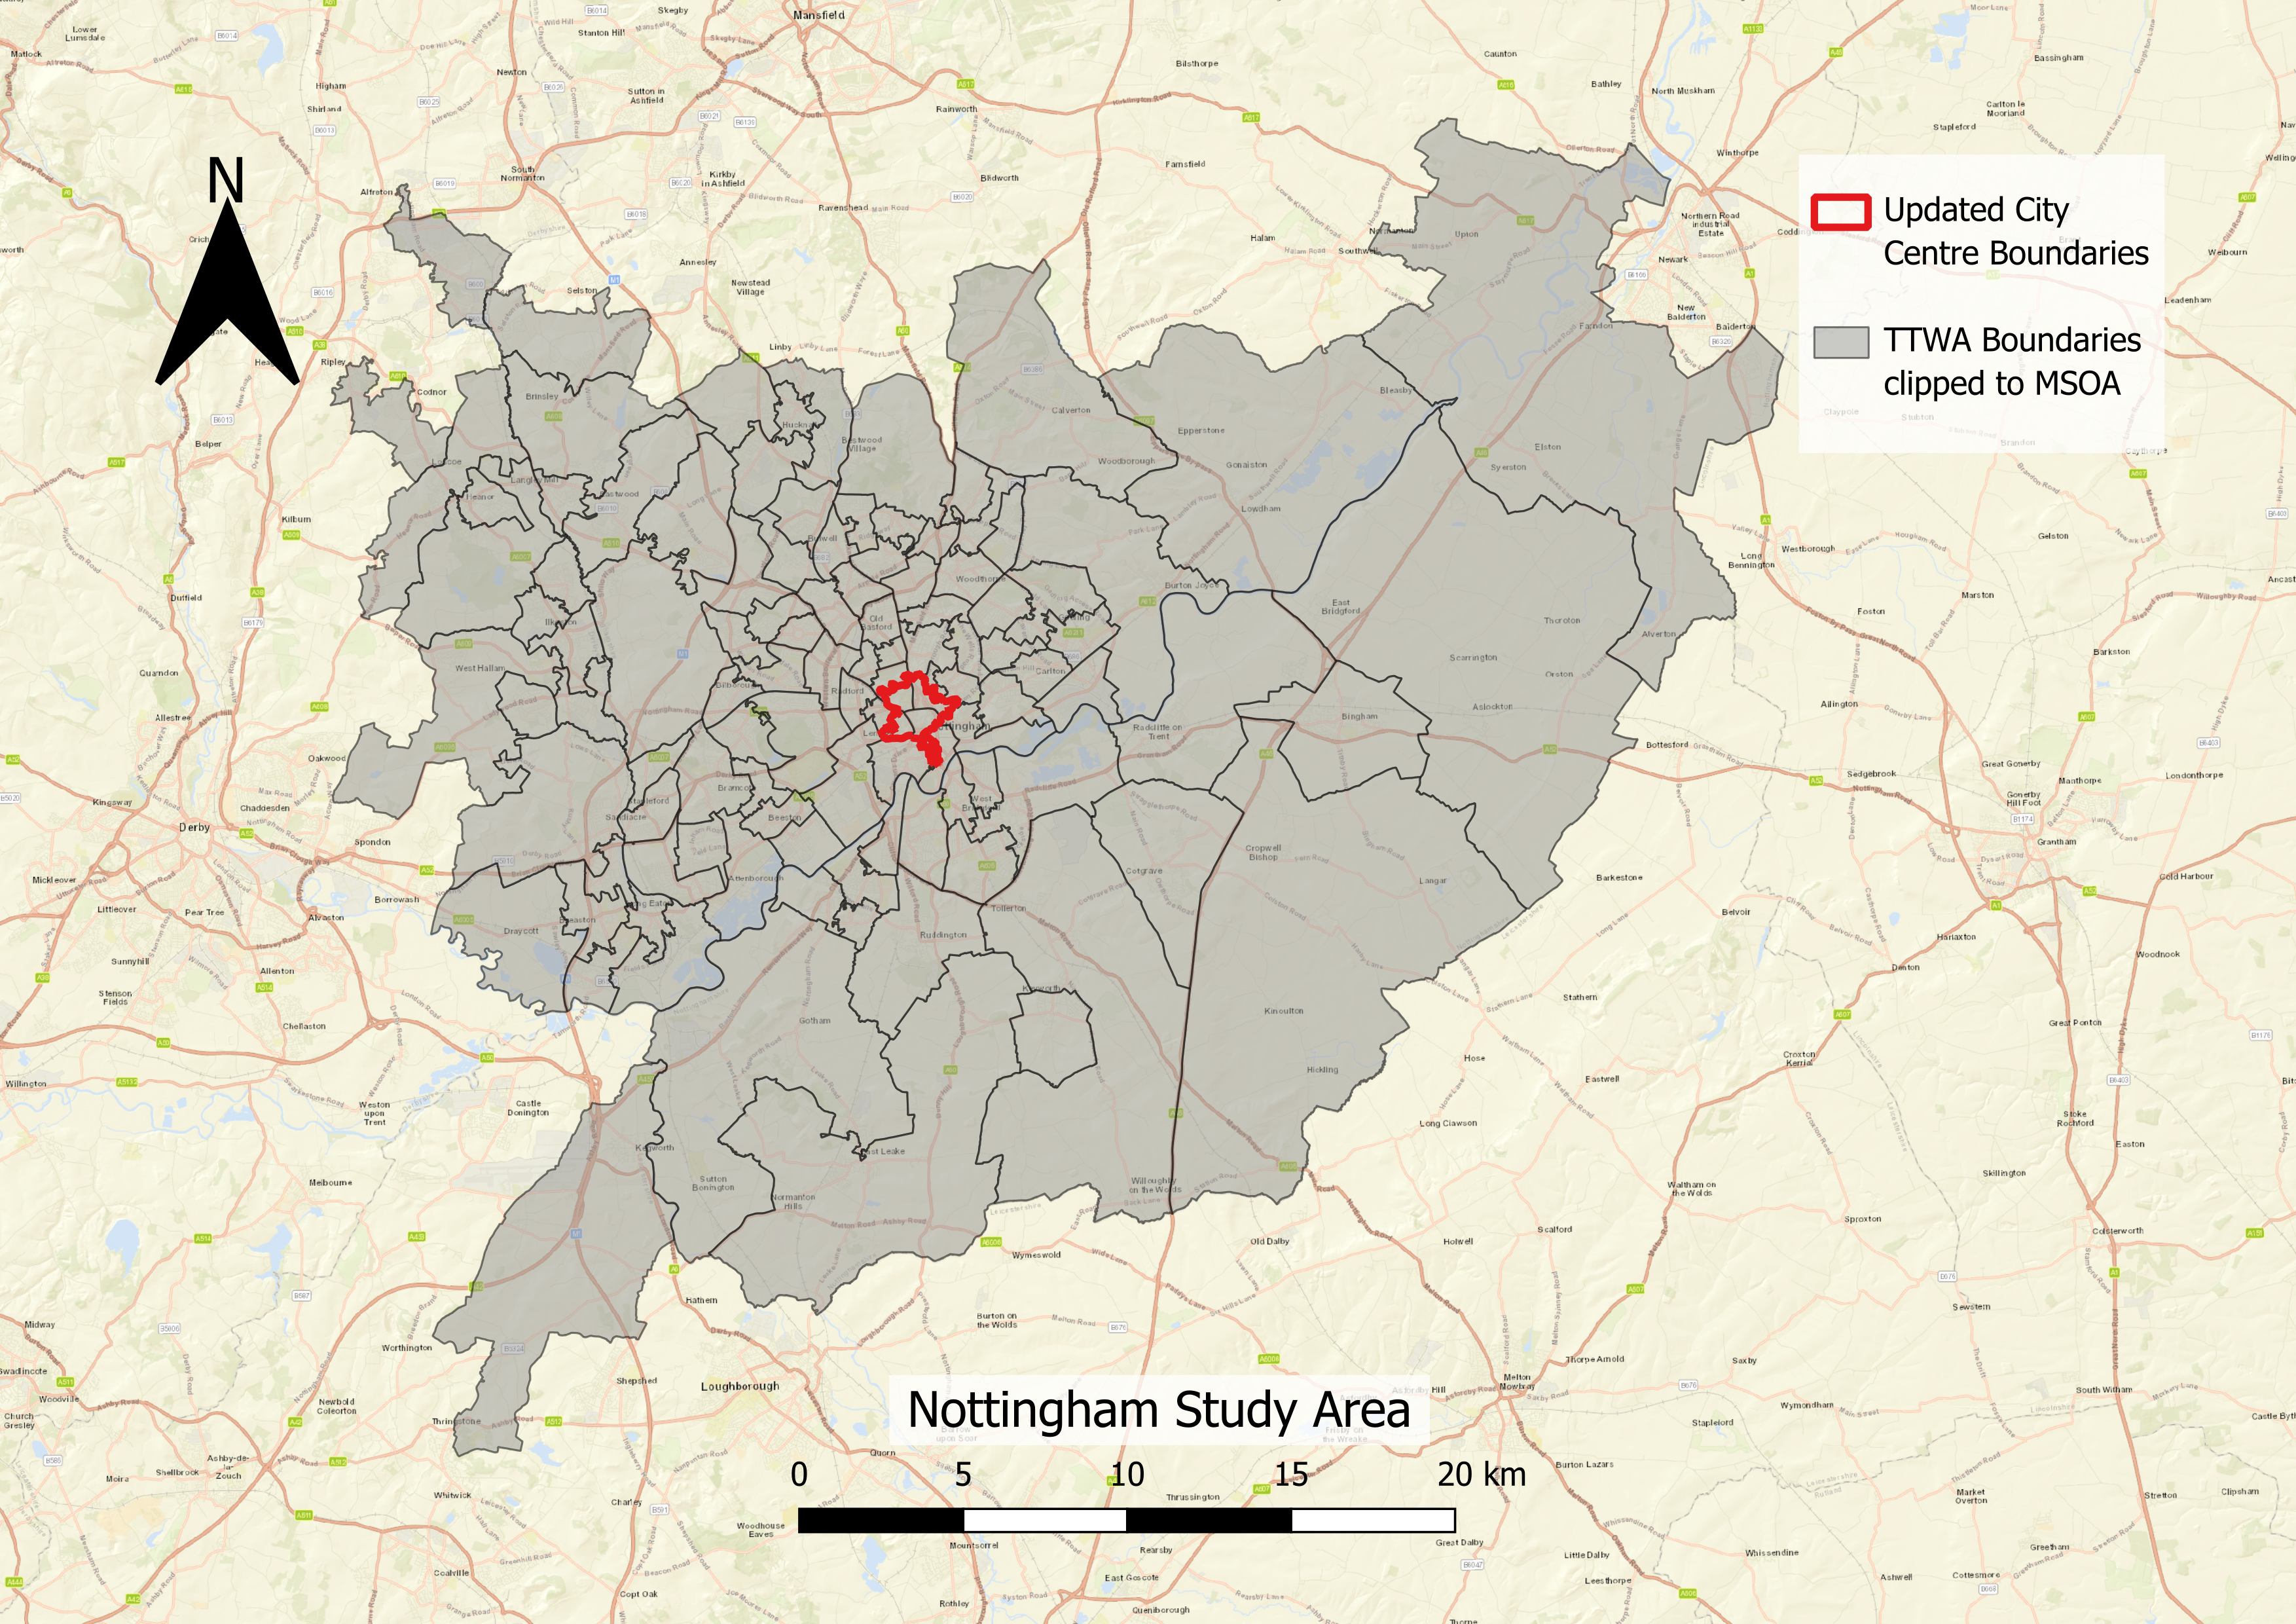
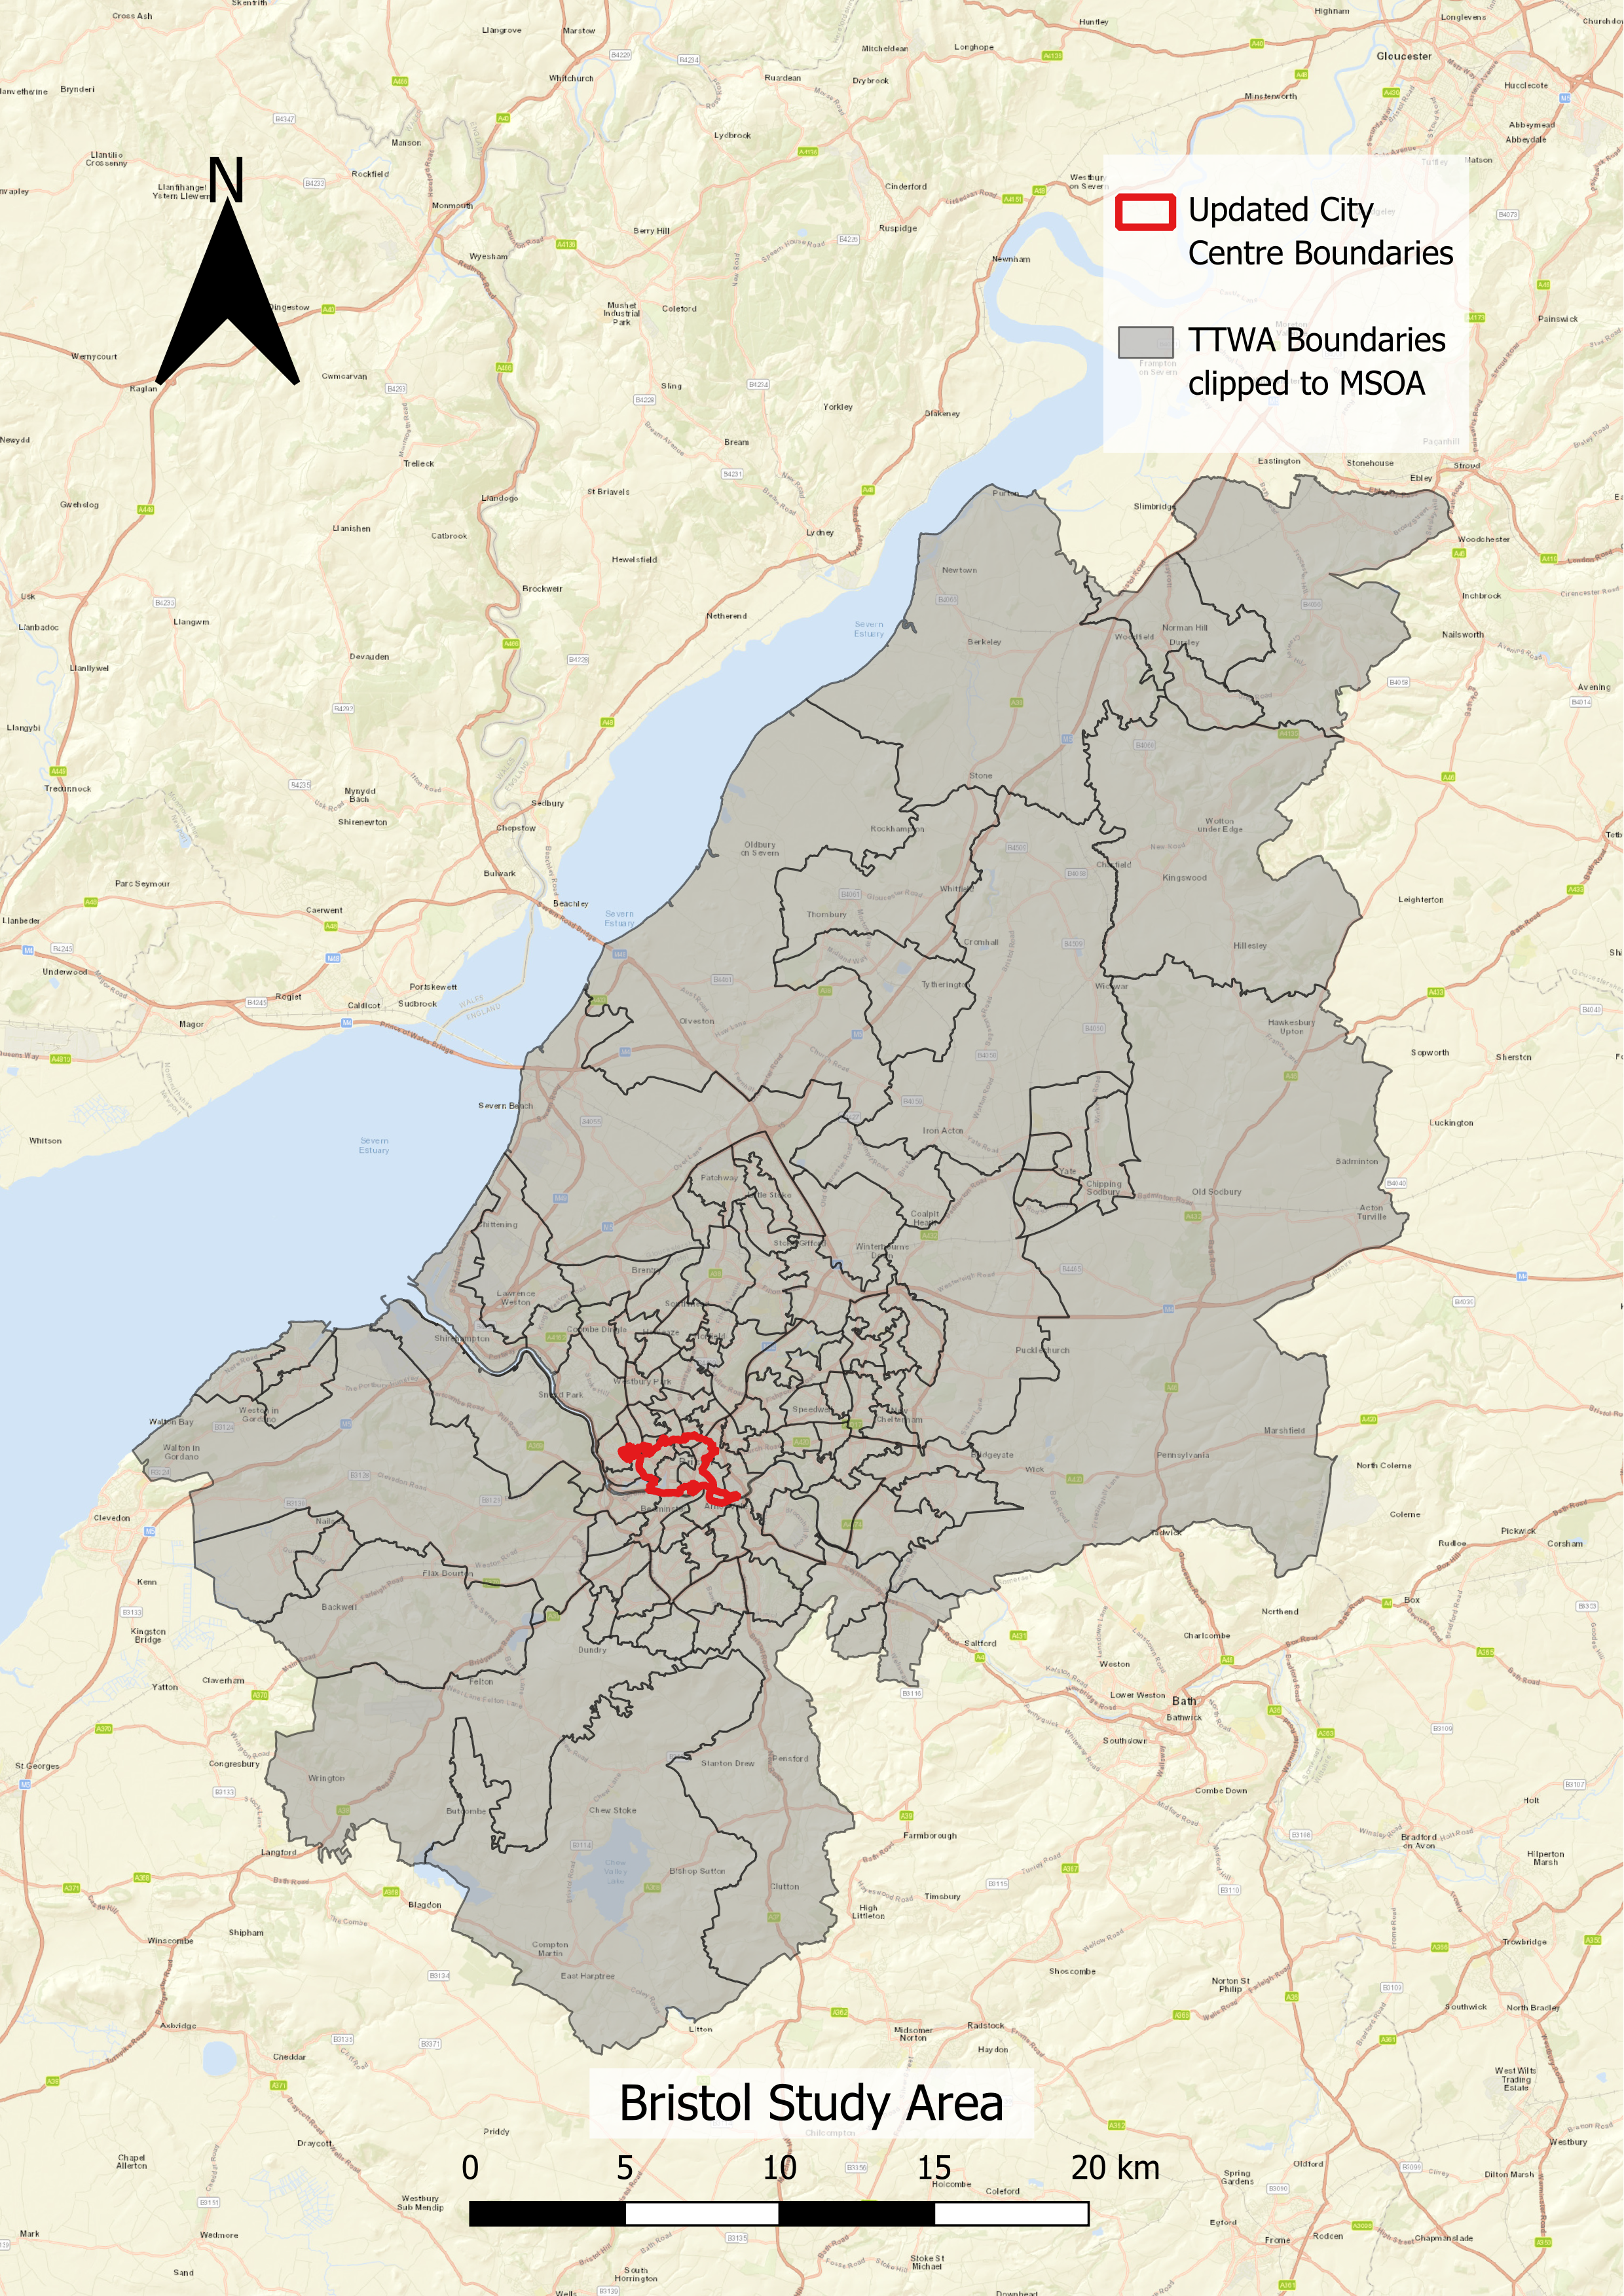
Nottingham and Bristol does not have the same local government structures as Greater Manchester. As a Singaporean, I don't understand how the local government system works, and I don't intend to. Fortunately, ONS has also published Travel to Work Areas (TTWAs), a geography that approximates labour market areas - essentially people largely live and work within these boundaries, which may not be the same as the local government boundaries that are about to change a lot more in the next few years, if a Labour government can remain by 2029. Therefore, in a similar idea as the city centre boundary adjustments above, I adjusted TTWA boundaries into 2021 MSOA boundaries, as follows.
1 / 3