Based on the steps outlined here, the scheduled-vs-actual accessibility of OAs to Manchester Piccadilly station by one bus trip during the morning peak hour on September 17, 2025, are shown in the map below!
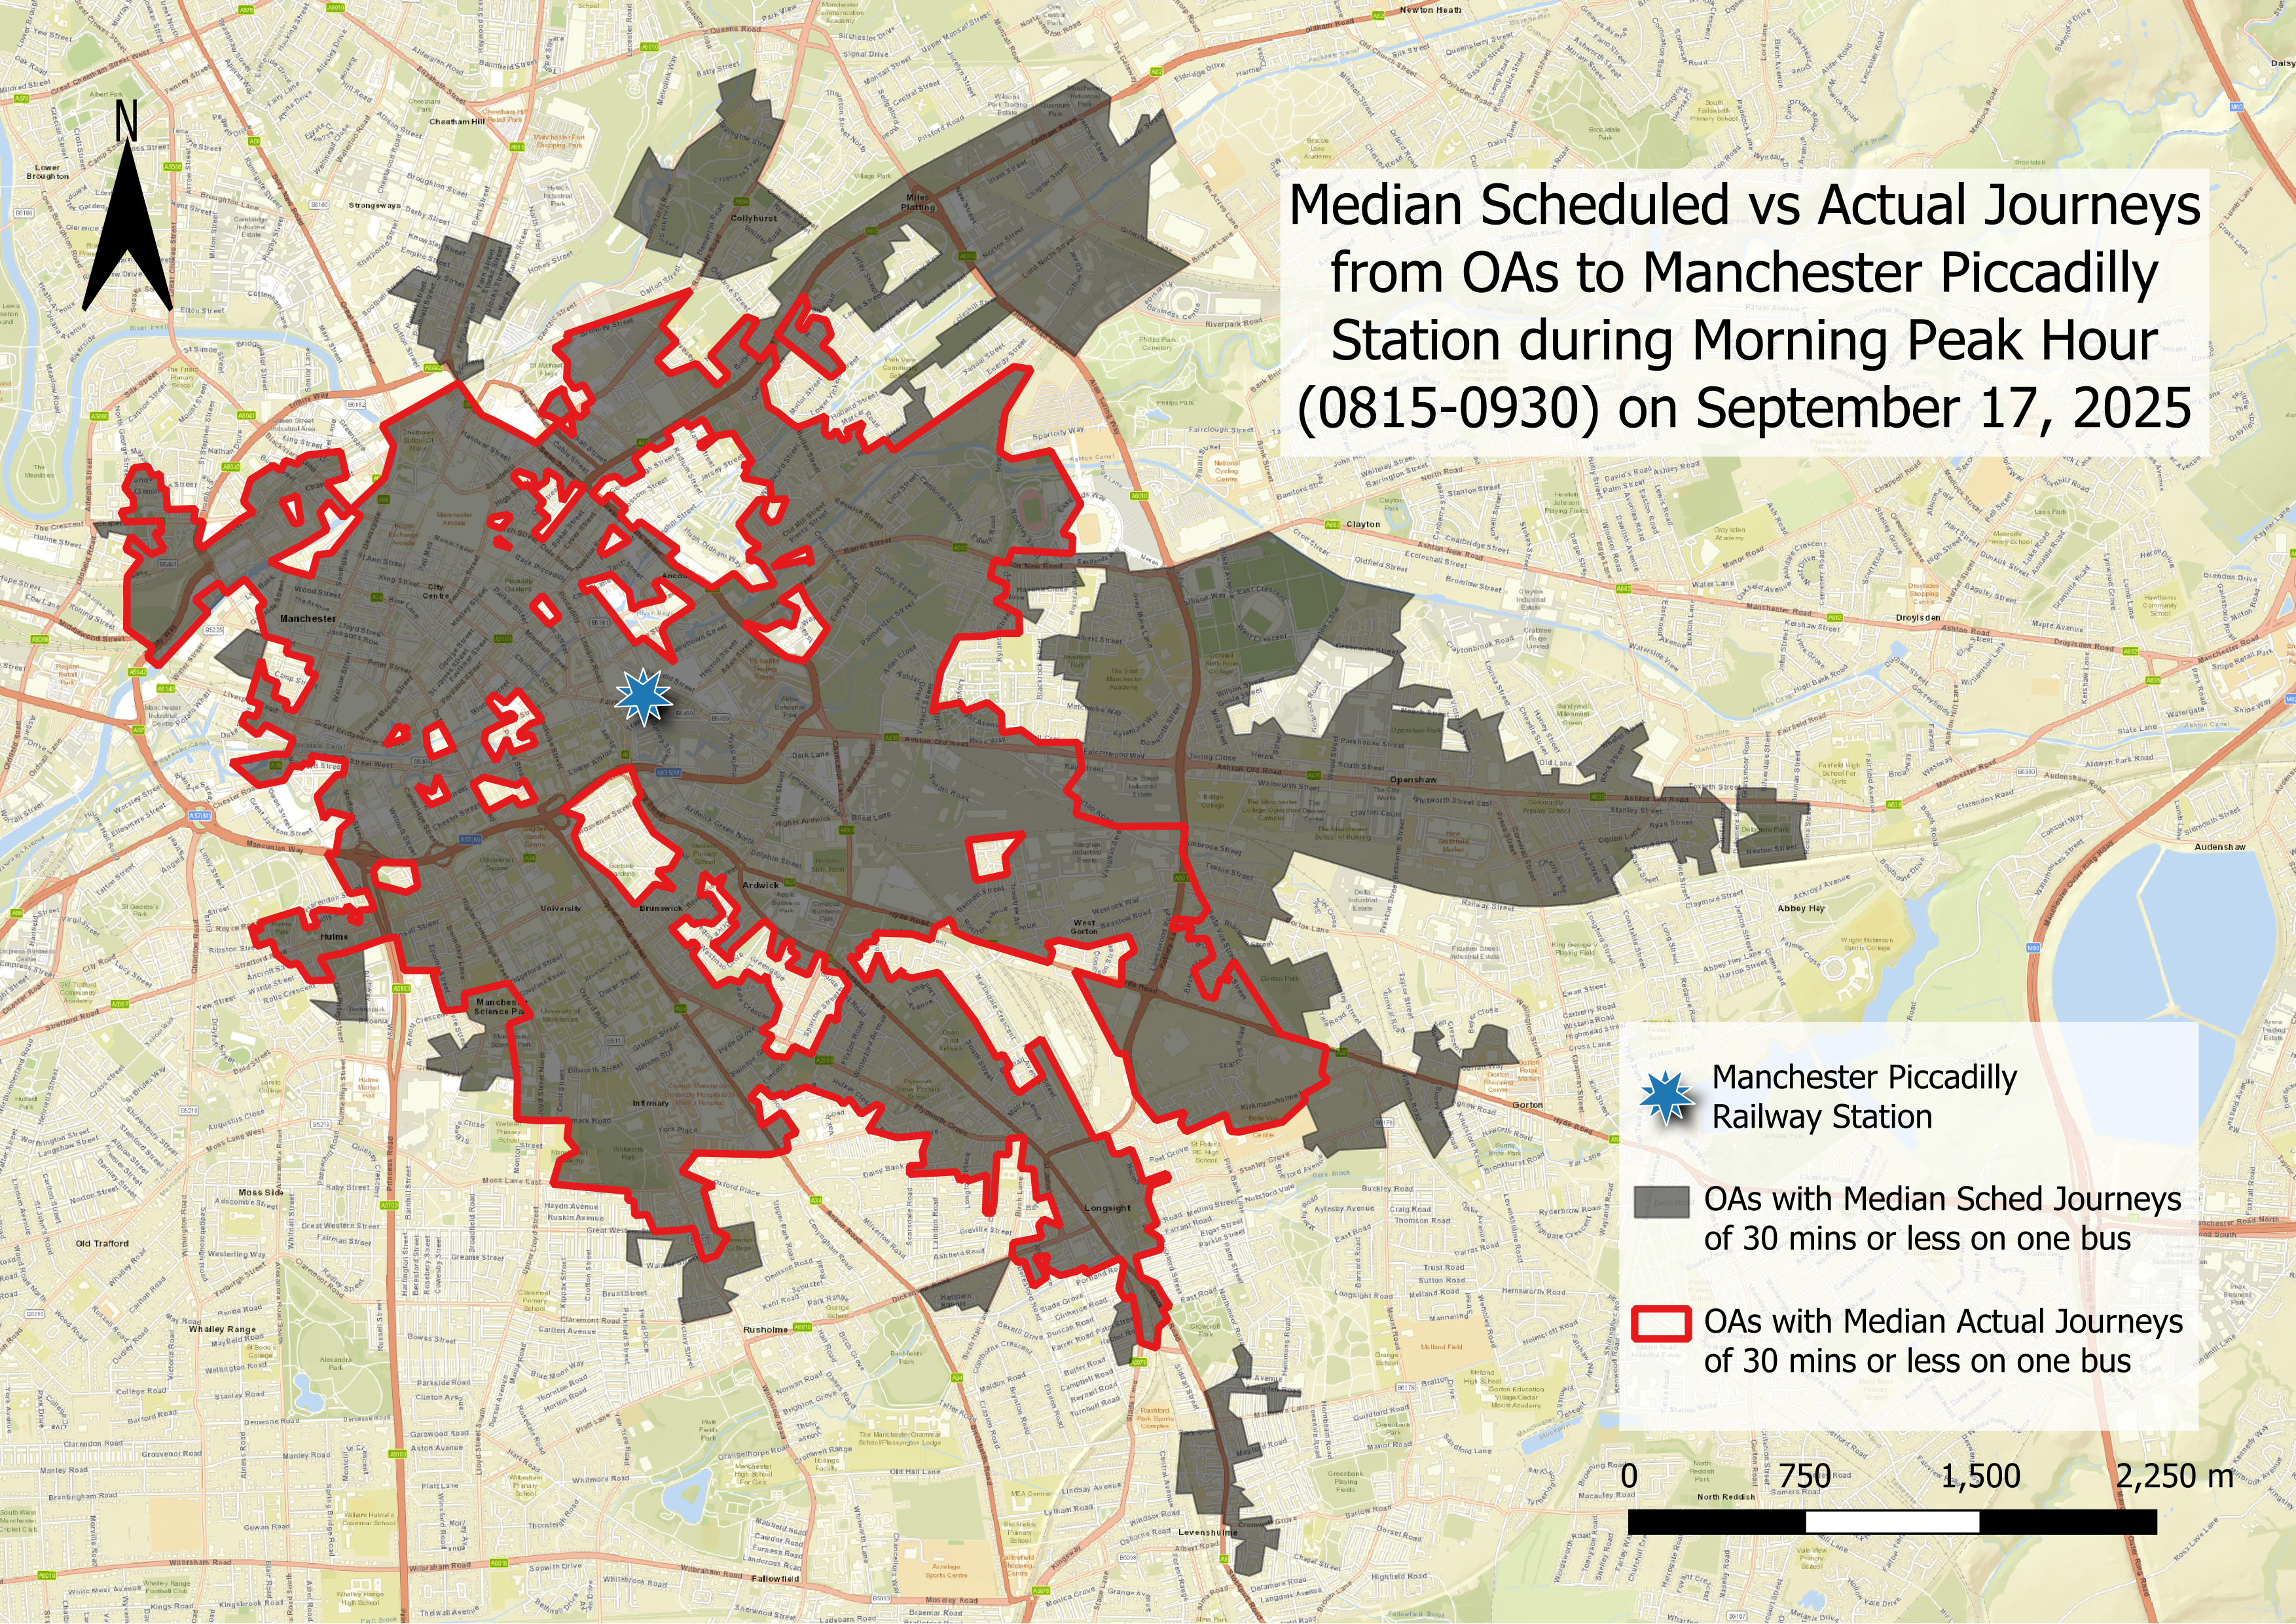 Quick-and-dirty map developed via QGIS
It should not be surprising that the scheduled accessibility (in grey shaded area) is larger than the actual accessibility (areas within the red
boundary) to Manchester Piccadilly. This quick-and-dirty analysis revealed that the gap is more apparent in the east, towards the direction of Tameside.
With little local knowledge that I have, I can only infer that there may be a huge gridlock along Ashton Old Road (A635), thus severely affecting buses
that ply that road into the city centre.
There are also some OAs closer to Manchester Piccadilly that are not shaded grey and not within the red boundary. This means that these are OAs that
do not have one direct bus route to Manchester Piccadilly during the morning peak hour on September 17, or if they do, the routes from the bus stops
would bring passengers on a detour such that travel times would exceed the 30-minute threshold. This is a clear indication that the accessibility
methodology needs to be improved because in a normal situation, these accessibility black holes when all surrounding OAs can reach the destination
within 30 minutes by bus do not make sense. All the more this is a sign that this specific result SHOULD NOT be compared to the CfC
report outcomes, at least not yet! This is because the CfC report measures accessibility to the city centre, which geography is NOT based on any formal
boundaries set by the ONS. CfC has the data on this, and I do not have them as of date. Meanwhile, my map is based on travel just to Manchester
Piccadilly, just one point within the city centre. So it is not surprising that when compared with CfC's visualisation of baseline conditions at 30
minutes, my map shows a smaller area of accessibility.
Based on the two methods that I have outlined here, the scheduled-vs-actual accessibility of OAs to Greater Manchester City Centre by one bus trip during the morning peak hour on September 17, 2025, are shown in the maps below! The left figure shows the comparison between Methods 1 and 2 when journey time is capped at 30 minutes, while the right figure is when the journey time is capped at 45 minutes.
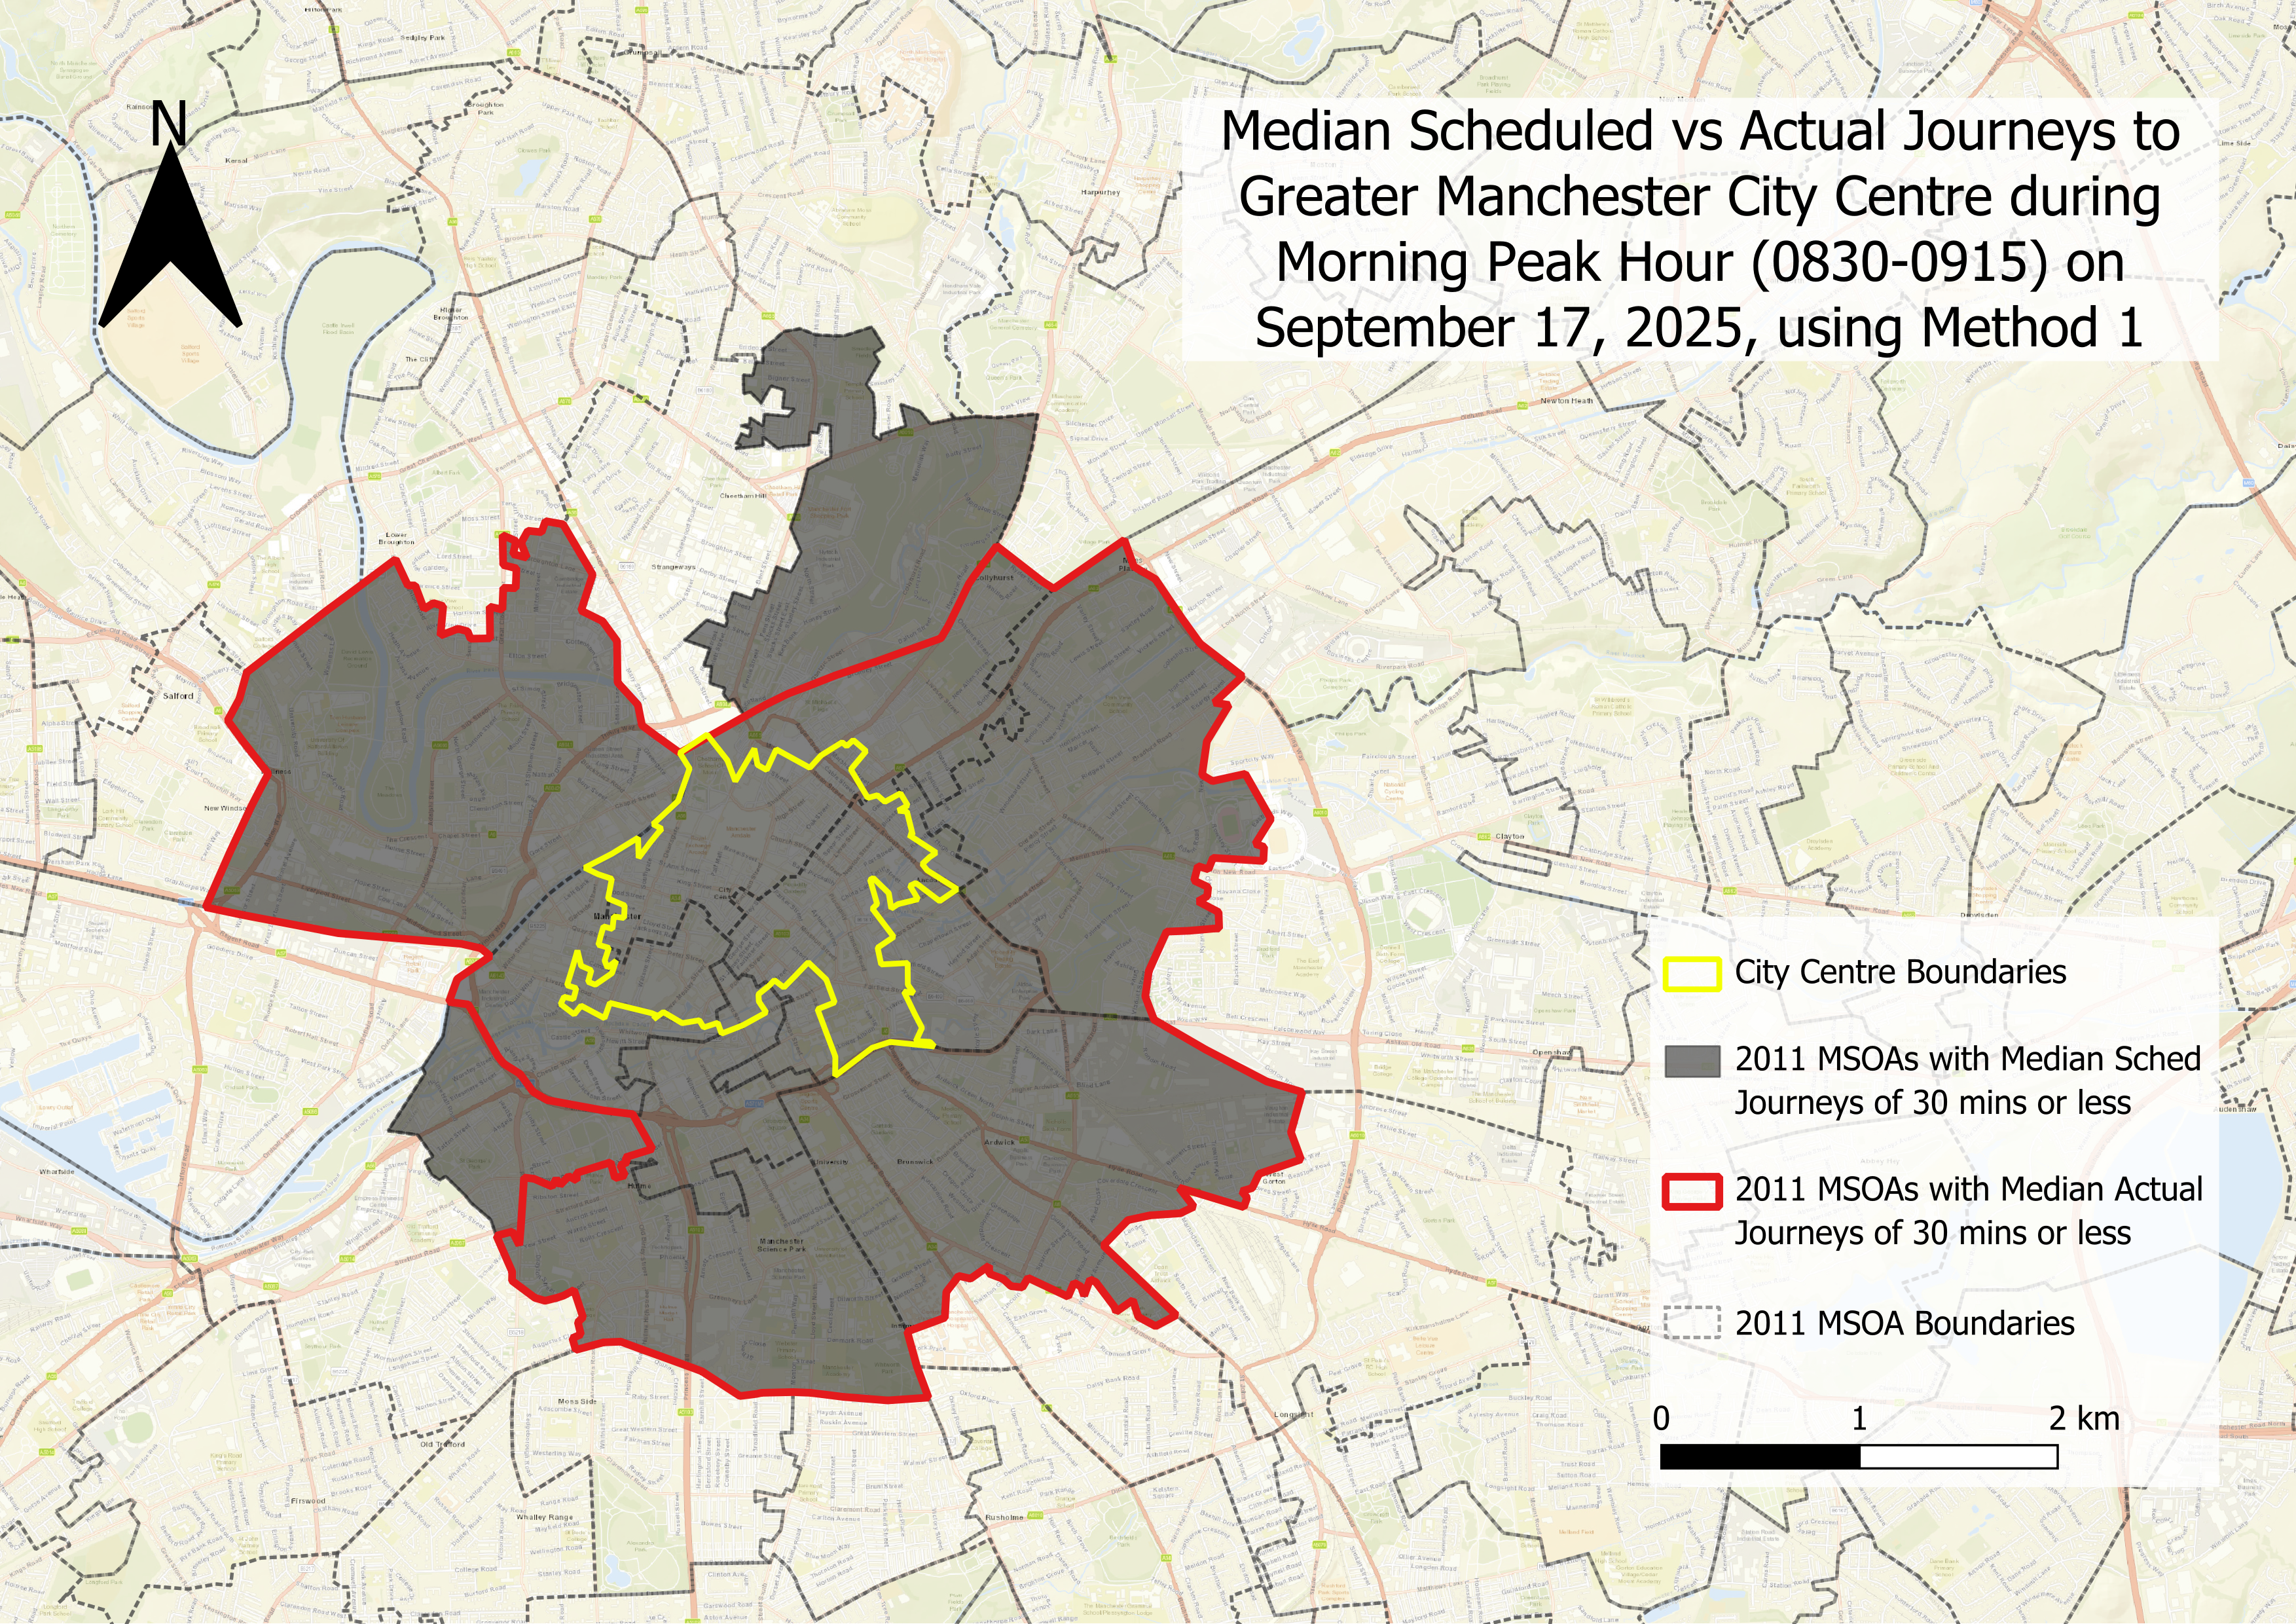
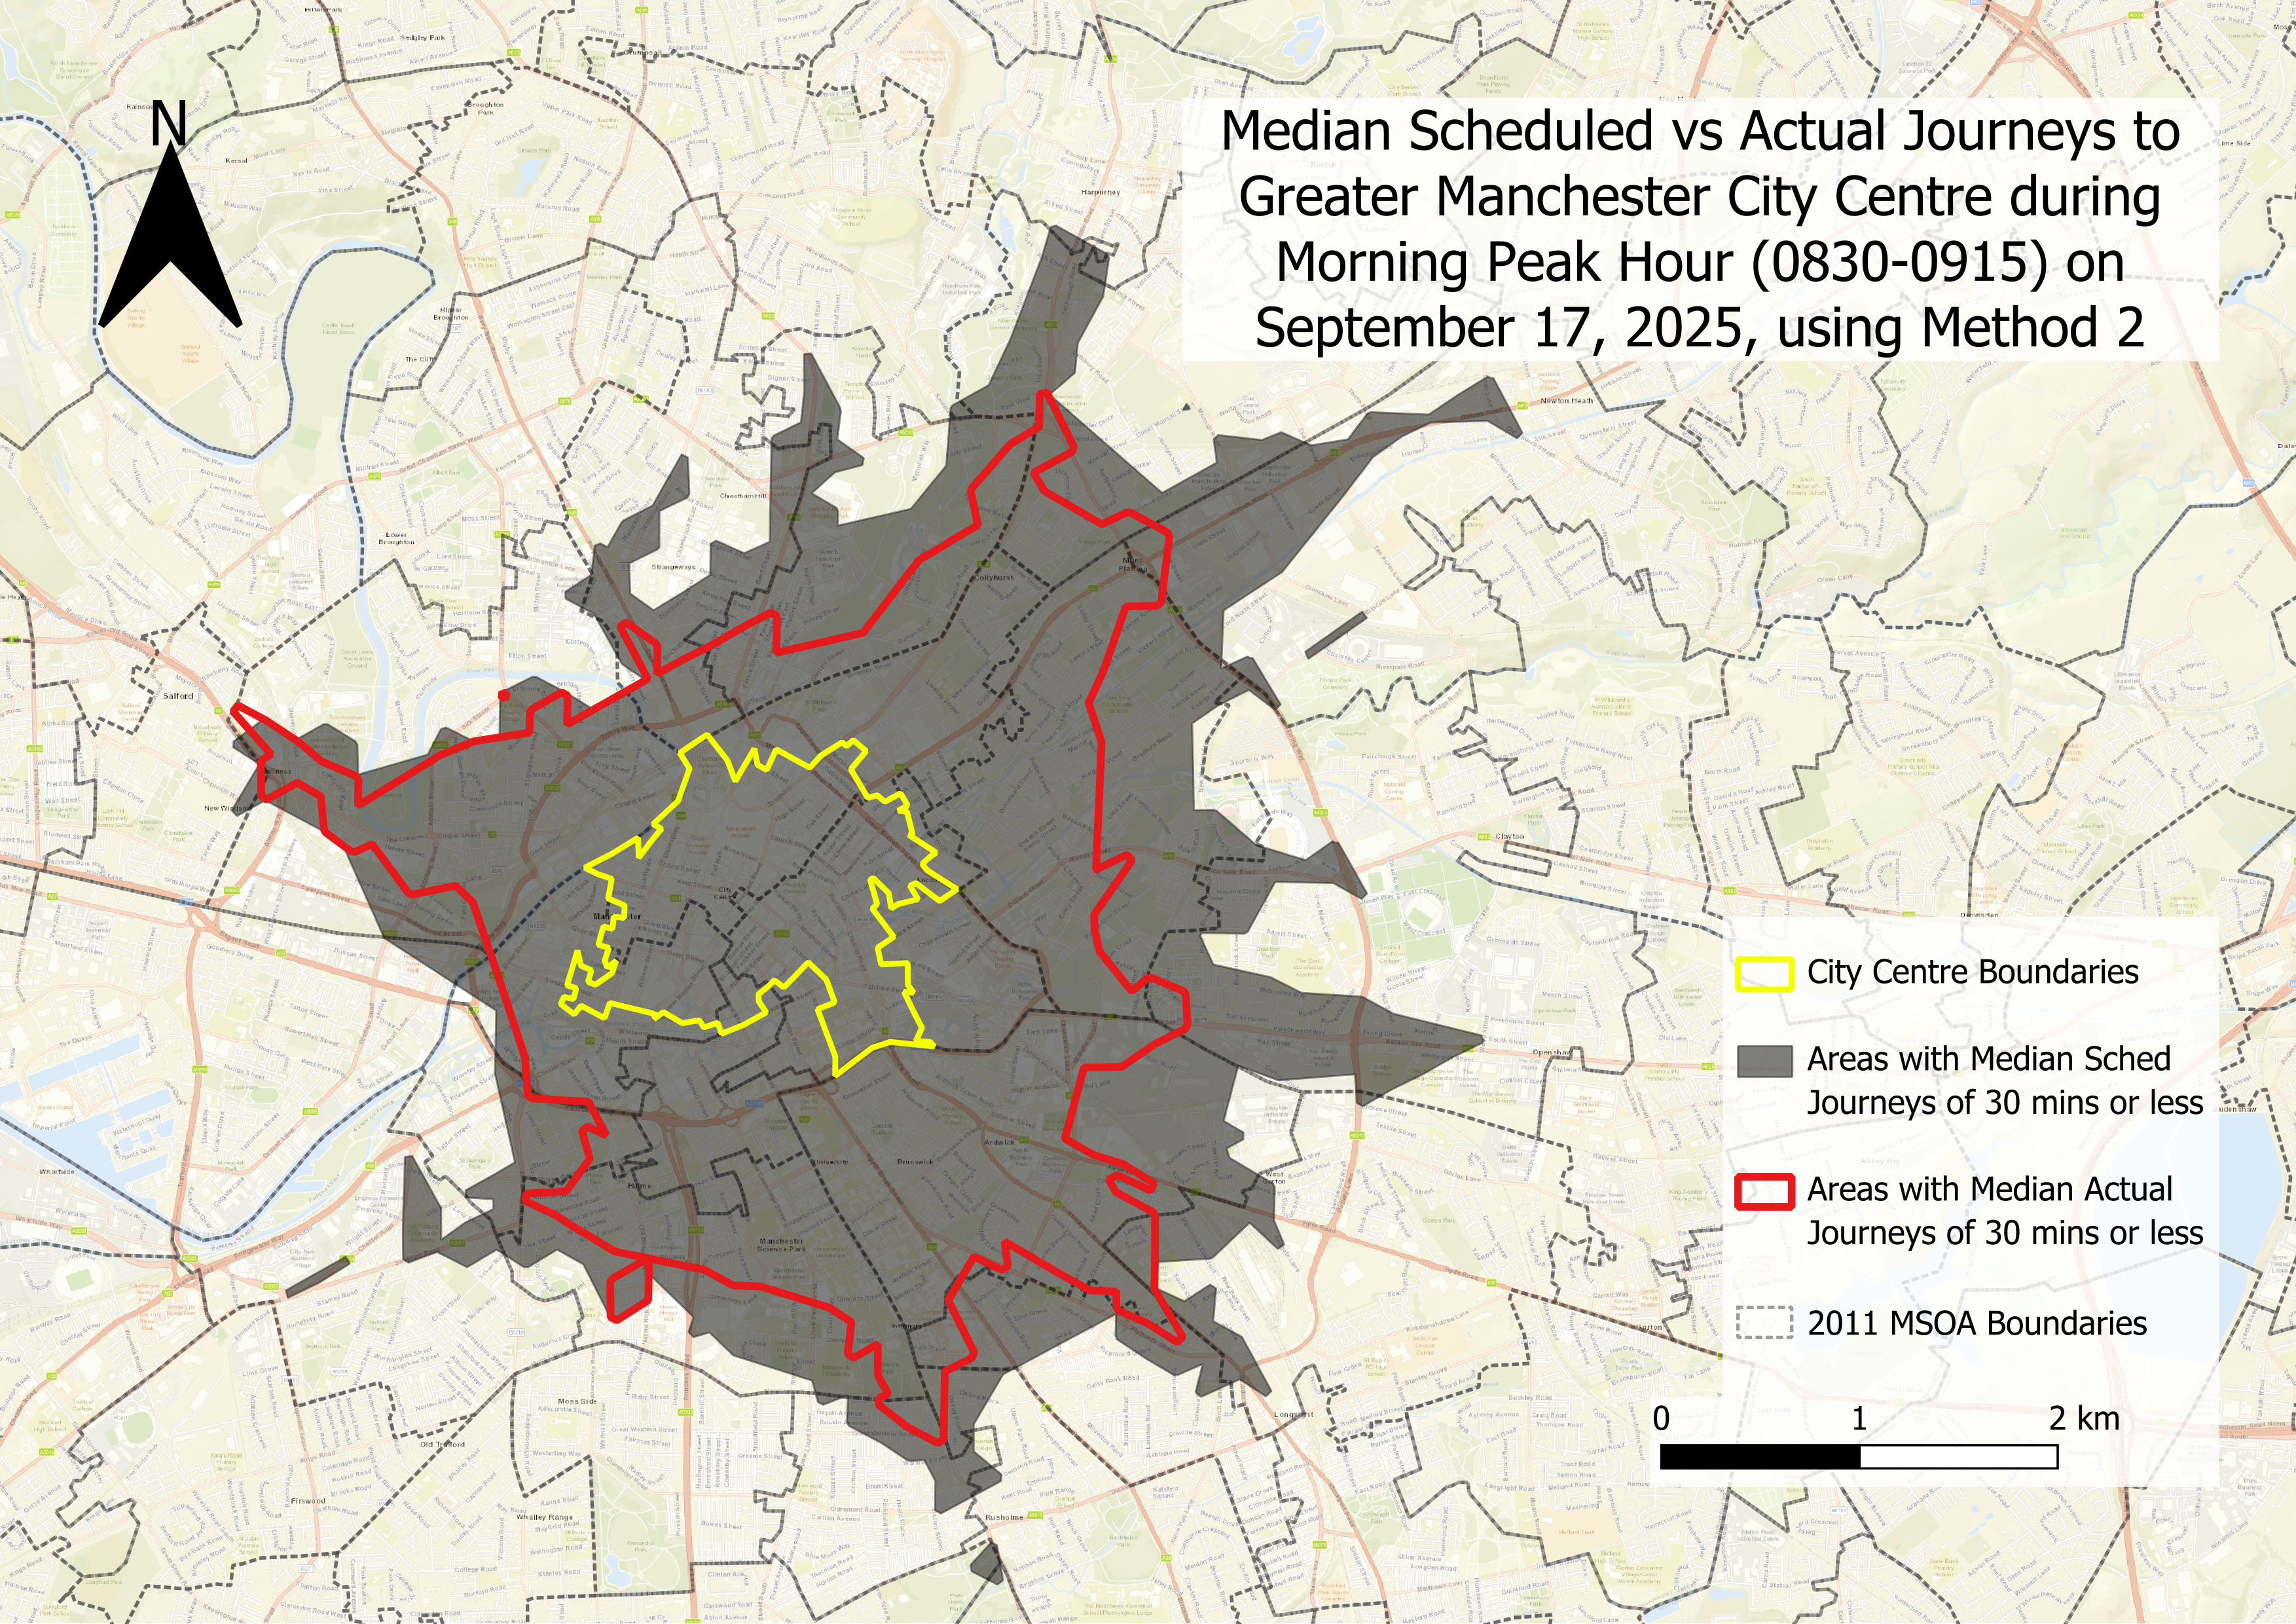
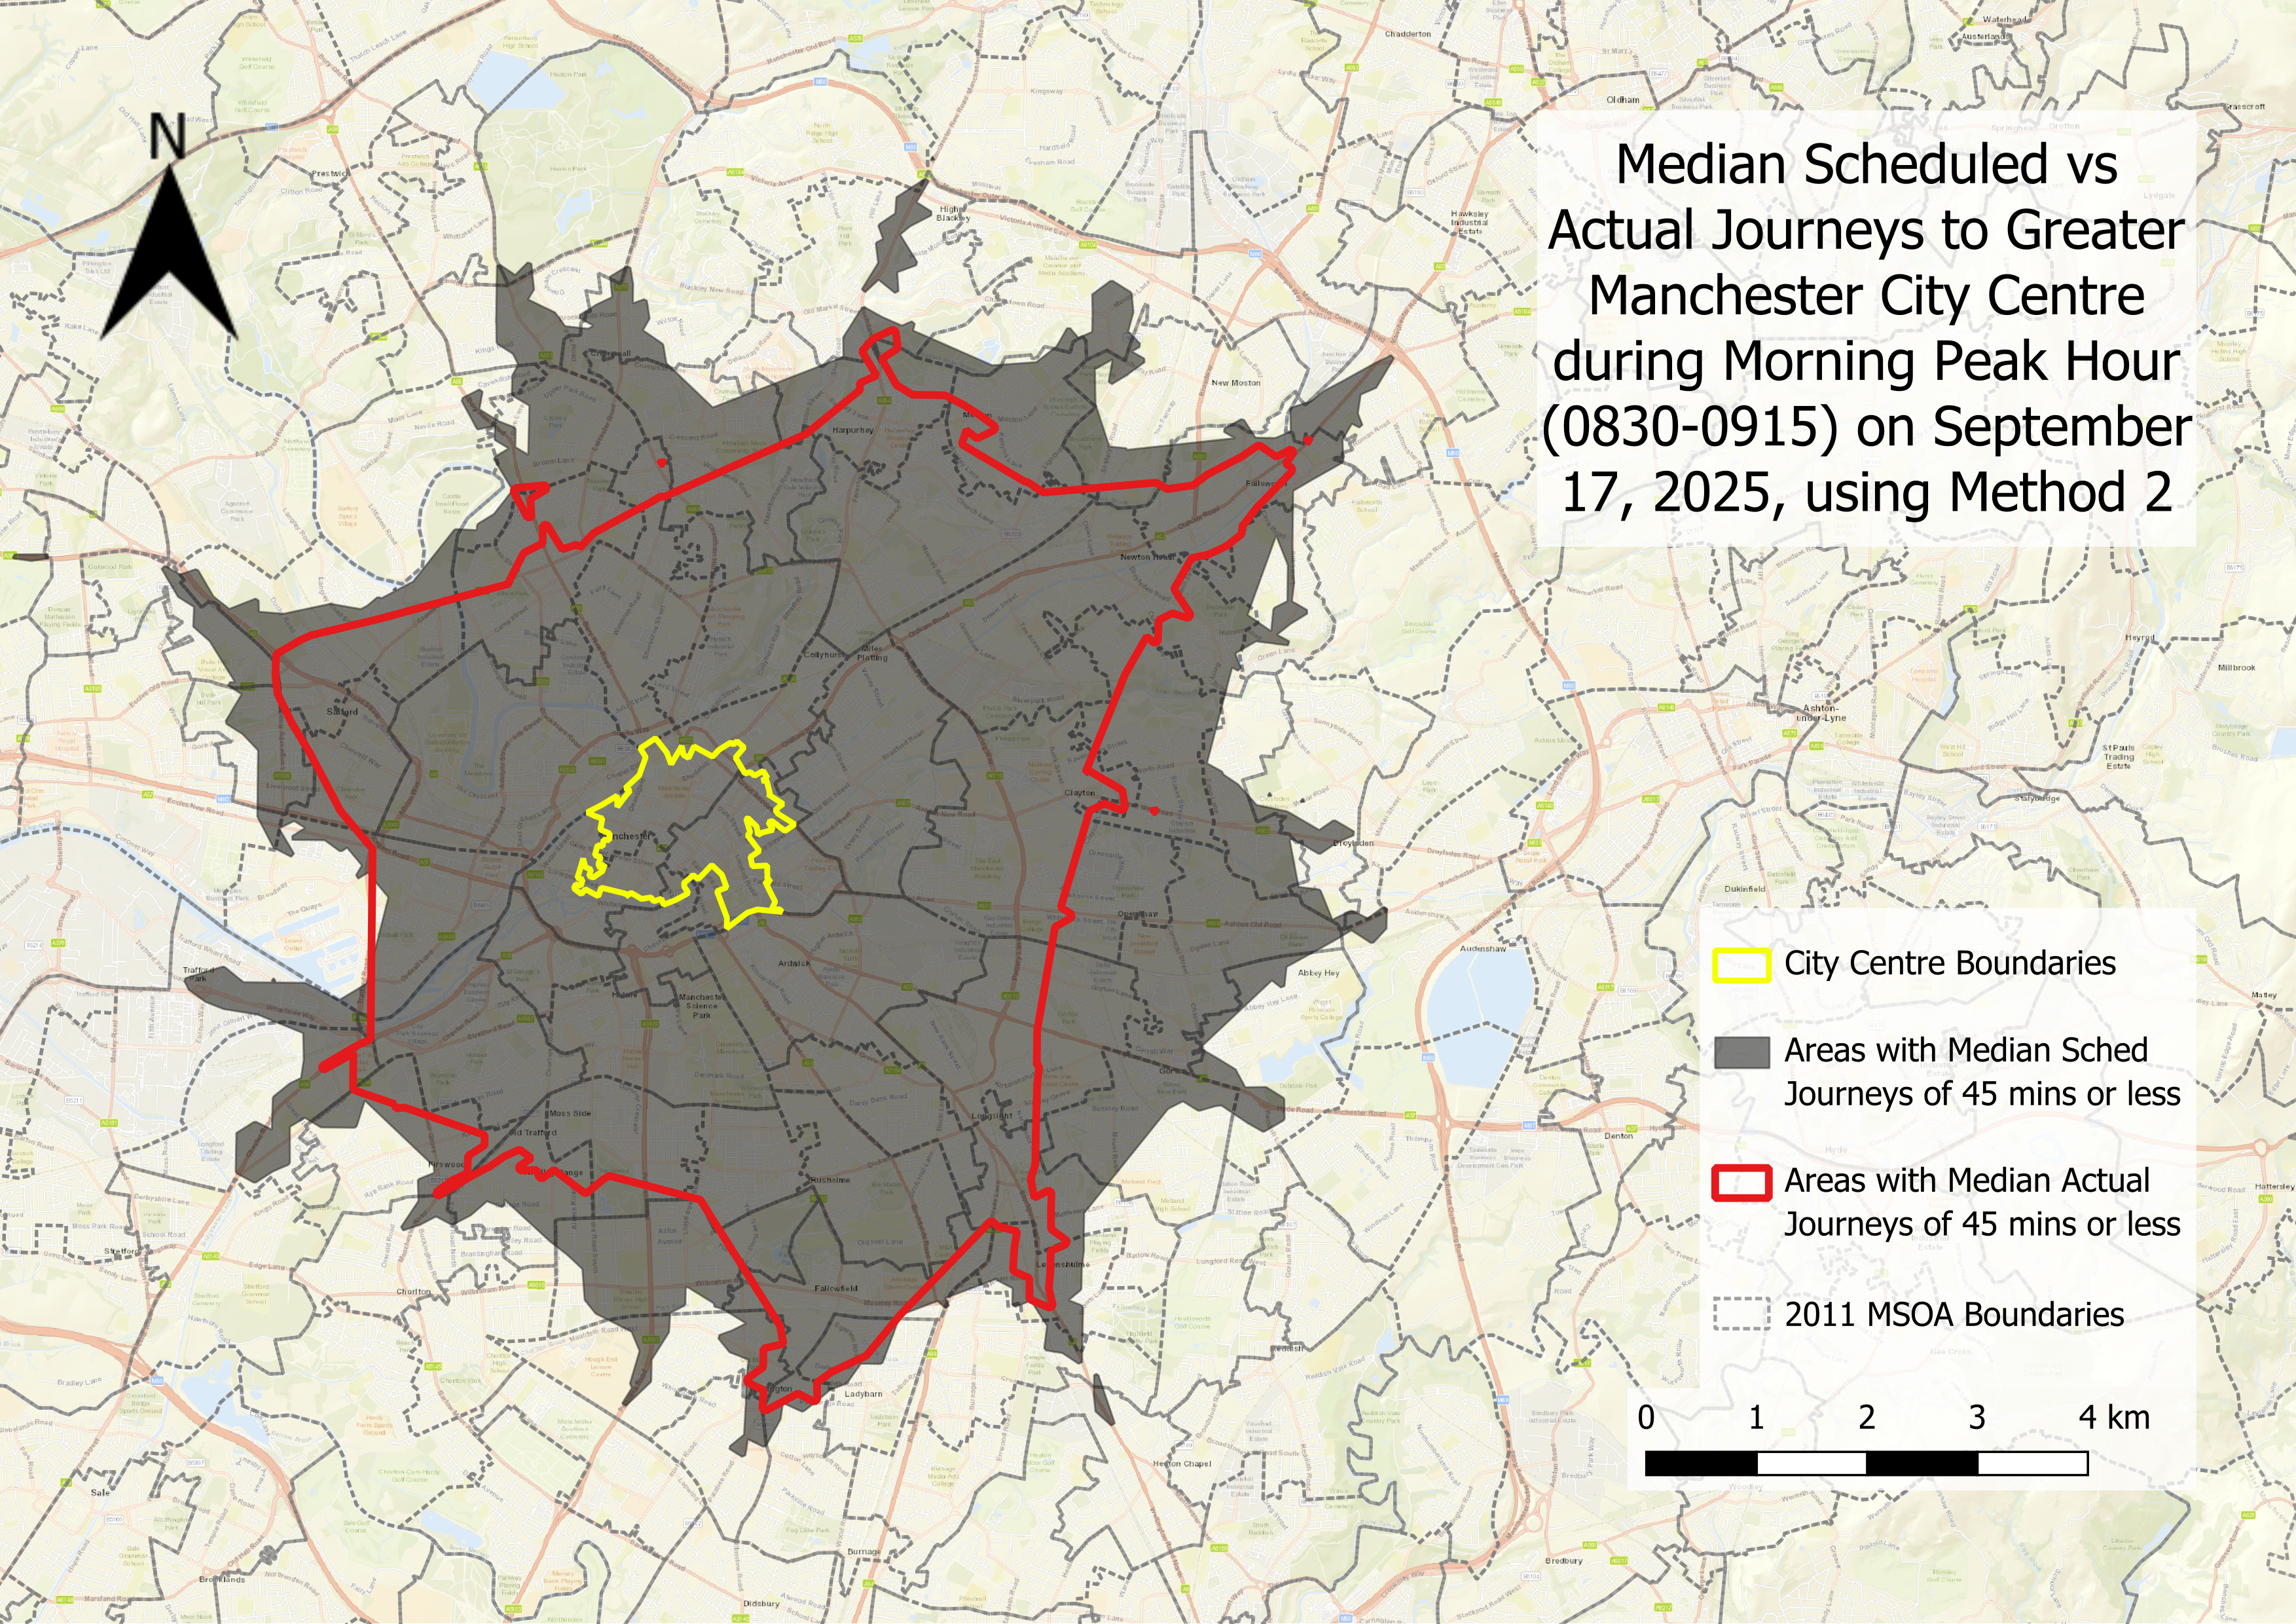
Comparing Methods 1 and 2 at the 30-minute threshold, they produce similar coverage areas where workers can have up to a 30-minute median scheduled and
actual journeys to the city centre. However, Method 2 reveals a larger scheduled-vs-actual accessibility gap in the east because ultimately it is NOT
tied to administrative boundaries. It is based on bus stops that fall within the time threshold followed by a walking isochrone expansion, and then
overlaid on MSOA boundaries for illustrative purposes. This gap is hidden by Method 1 because it only uses ONE point - the population-weighted centroid
of each MSOA - as origin. This means that the population-weighted centroids of MSOAs that lie east of city centre are still closer to the city centre,
thus falling within the 30-minute threshold based on actual bus travel times, therefore the whole MSOA is considered as 'within 30-min accessibility by
actual travel times' and the accessibility gap disappears.
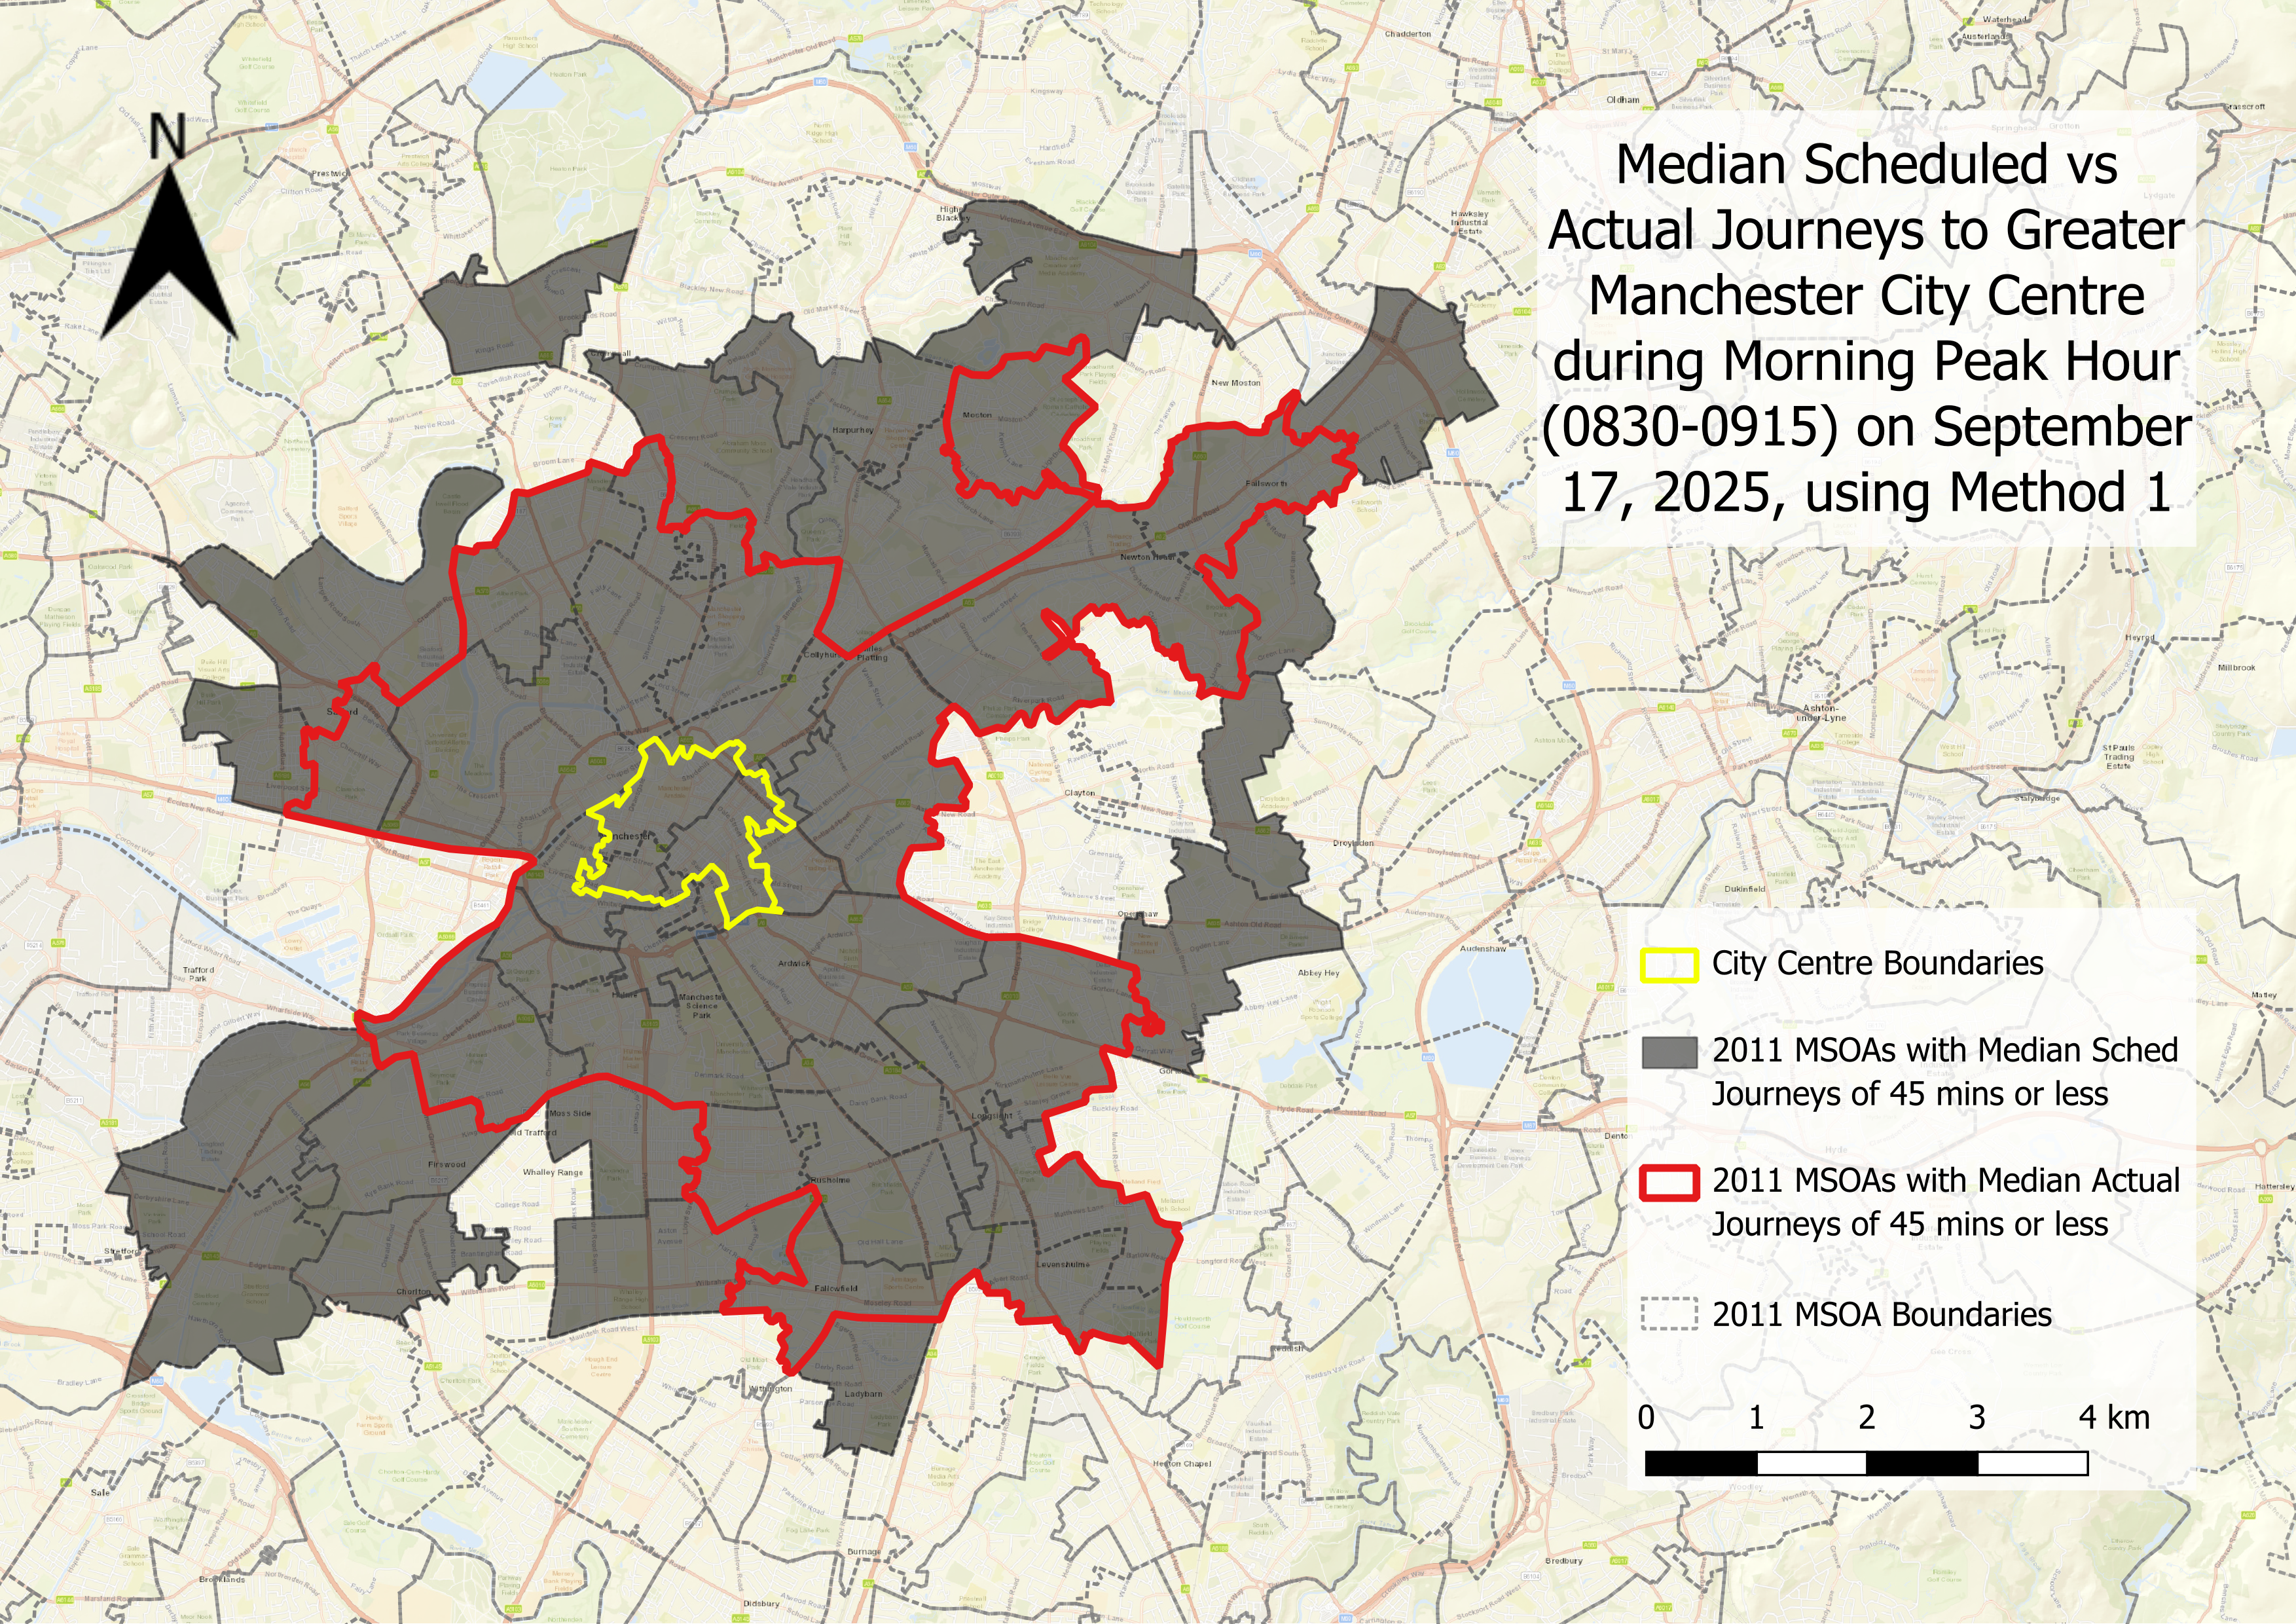
Methods 1 and 2 start to diverge when looking at the 45-minute threshold. Notwithstanding that the coverage areas are larger (which should be the case
anyway for a longer time threshold), Method 1 produced not just a scheduled-vs-accesibility gap, but also an accessibility 'black hole' in the east of
city centre, which means that it cannot reach the city centre by 45 minutes even based on scheduled services. This would put them into my third inquiry
line (see here"), but this 'black hole' does not exist when looking at Method 2. Additionally,
Method 1 identified MSOAs that could be reached within 45 minutes of scheduled services in the south-west of the city centre, but Method 2 did not go
as far.
At this point, Method 2 seems to produce more realistic results but it is not easily mapped onto MSOAs. On the other hand, Method 1, by using just one
point (the population-weighted centroid) per MSOA as origin to determine the travel time for the whole MSOA to the city centre, makes it easier to bring
in ONS's counterfactual data for the second part of dissertation. At this point, neither Methods are fully suitable on its own. The best solution seems
to be updating Method 2 and incorporating elements from the method used in the
first quick-and-dirty exercise.