As I staked my claim to bring in OD matrix data as my primary contribution to this research, the next immediate step is to then source for the
appropriate OD data. One of the most common providers of OD data is public transport operators, such as Transport for London (TfL), which uses
tap-in-tap-out data to show where people start and end their journeys.
Public transport-derived OD matrices however is not necessarily the best tool for my specific case because it is data about flows between public
transport stops for all kinds of purposes. My research is more on improving accessibility to city centres for WORK purposes, thus what I need is data
about how many people travel from home to work using public transport. The best option in normal situations should have been Census data, where respondents
declare where they live and where they work and the Office for National Statistics (ONS) do their statistical processing magic to produce a table
aggregated by geographical units (regions, local authorities, MSOAs, etc) -- this is also known as Travel To Work (TTW) data. The Census also collects
information on the mode of transport used to travel to work!
The Problem with Census 2021 Travel To Work Data
However, the most recent Census in England was done in 2021, specifically March 2021, nowhere near normal from COVID-19. Respondents were asked to report where they worked ON CENSUS DAY (March 21, 2021) unless if they were temporarily furloughed. So obviously a substantial number reported that they worked from home. As a result, Census 2021 data is actually only useful when studying pandemic-induced mobility patterns, not when I want to understand mobility patterns in 2026 and propose concrete improvements.Alternative 1: Locomizer Mobile Phone OD Data
This is something that I encountered from my final coursework for CASA0002: Urban Simulation. Locomizer, the company that sells the data to the researchers, aggregated the data from over 200 apps used by almost 800,000 devices - so essentially it came from UK-based apps where you guys may have agreed to share your location details while using them or at all times! One of the OD matrices that the researchers produced is on how many trips from a home MSOA to a work MSOA in total in November 2021, based on 2021 boundaries. This is not exactly what I need because it is a specific monthly aggregate (not a daily average) of trips made by the devices (not people). Inasmuch as November 2021 was when the lockdowns were slightly eased in England, I have been advised that it may not be fully representative of post-COVID commuting patterns (the post-COVID patterns somewhat reached an equilibrium only by 2023).Alternative 2: Generating My Own Hypothetical 2026 TTW OD Data
Cognisant of the hot mess that was Census 2021, and the impacts that it had on the TTW, the ONS actually produced TWO counterfactual TTW datasets for 2021, assuming pre-COVID and during COVID travel patterns. They explained at length about how they produced their estimates using doubly-constrained spatial interaction modelling (SIM) and compared it with the actual Census 2021 TTW data - both counterfactual TTW datasets produce higher aggregates of people commuting to work than the actual Census 2021 TTW dataset. While I could stop and use this data, the ONS made it very clear that this is experimental and should not be used to make policy decisions because they have not been able to validate their counterfactuals with more accurate data (mobile phone data, regional travel diaries, etc). Also, the data is based on MSOA 2011 boundaries, not even the most recent one, but it may be a small boundary issue after all...What I am interested in doing though is to follow the steps that ONS has outlined in their report to make my own counterfactual OD data up to 2026. THIS is where I had my first back-and-forth with Claude to identify the feasibility of this idea just for an MSc dissertation - and Claude pushed back hard.
- Firstly, which base OD data am I going to use to calibrate the doubly-constrained SIM that will in turn generate the 2026 counterfactual OD data? The quality of my generated OD data will only be as good as base data used to calibrate the parameters, remember GIGO...
- Secondly, my generated 2026 data will also be just another experimental OD data - I will run into the same validation problem as ONS...
- Thirdly, some of the data that the ONS used in generating the counterfactual data is not accessible to the public - they have the data because they collected it to begin with and it cannot be released due to GDPR issues. So I cannot recreate it to the tee...
- Lastly, this is a mission creep for my MSc dissertation, especially if my initial aim is to already do doubly-constrained SIM to estimate impacts of public transport integration in large British cities...
Alternative 3: Huq Mobile Phone OD Data
This is similar to Alternative 1, but I do not know if the OD dataset is on flows between any two MSOAs for work or for all purposes combined. This is because it did not come with any technical report/journal article like Alternatives 1 or 2, and the dataset itself is actually safeguarded by the Urban Big Data Centre, a think tank affiliated with University of Glasgow. I am in the midst of trying to get access to it. The only thing I know is that it uses data from a broader time period (2019 to 2023) instead of just one month (November 2021 for Alternative 1) and that it produces OD data for just five British cities, three of which are English (Manchester, Birmingham and Bristol).At the moment, none of the three alternatives are satisfying. I am not sure how to move forward with this...
As of date, I only have full access to the ONS counterfactuals and Locomizer data. I have not had access to the Huq OD dataset yet. I won't do a full
statistical evaluation of the datasets, I just need to do a sanity check and see if any of them CAN be used for my dissertation. Also as of date, the
only authoritative data that I trust which provides OD data post-COVID is the
Greater Manchester Travel Diary Surveys (TRADS), which they have been doing annually since 2022.
Latest data is for 2024 (I am going to assume that 2025 outcomes would only be published in late 2026, after my dissertation is due). So the idea is to
compare the ONS counterfactuals and Locomizer data with 2024 TRADS data, essentially somewhat 'validating' it with actual data for one city region. I
would have loved to at least validate it with one more city region (Greater London) but TfL does not release OD data from borough-to-borough like
Greater Manchester.
This is where I asked Claude to suggest me two to three ways to compare the potential OD datasets with the 'gold standard' (2024 GM TRADS). Claude
suggested me the following:
- Aggregate the OD data into the Local Authority level and just eyeball the differences. No stats madness needed
- Pearson's Correlation Coefficient: This will show if the travel patterns exhibited in the potential datasets match the 'gold standard', even if the actual numbers are wildly off
- Standardised Root Mean Square Error: This will show how far off the actual flows are in the potential datasets from the 'gold standard', by dividing RMSE by mean size of an OD pair flow in the 'gold standard' dataset
This is NOT exactly the same as using R-squared and RMSE values to evaluate a fitted model from the observed values because I have not fitted any model
yet - I am choosing which dataset for my baseline to begin with. Therefore, I would not care much about variance of potential datasets from 2024 TRADS,
I am more interested in whether the potential datasets highlight the same Origin-Destination pair/s as having the same degree of high flows as 2024
TRADS -> using R value instead of R-squared. Additionally, I am not comparing a fitted model that came from the exact base data as the observed, it is
between two differently-generated datasets, thus I need to standardise the RMSE.
Pre-Processing Steps
1. 2024 GM TRADS Data (the 'gold standard')
Greater Manchester publishes daily average trip data at district (local authority) level, not MSOA, after they have expanded the results from their sample. That is why this entire sanity check needs to be done at LA level. Helpfully, they have provided a fairly detailed breakdown of trips based on purpose, so I am able to isolate trips for 'business and commuting'. They also published Origin-Destination data as percentage shares out of total trips originating from each LA, not raw trip counts. Nevertheless, they also separately provided raw trip counts after rounding off, so I could reverse engineer the specific flow numbers from LAs to LAs.2. Locomizer Nov 2021 Data (Potential #1)
As previously mentioned, the researchers isolated for trips to work throughout November 2021 from their overall mobile phone data (which is claimed to be about slightly more than 1% of England's total population) and arranged them into OD matrices based on MSOAs using 2021 boundaries. So, some calculations needed to be done - expand the data to cover the entire England population, and then divide by the 30 days in November. Only after that could I use the 2021 MSOA-LAD lookup to aggregate them to LA level.3. ONS Counterfactuals Data (Potentials #2 and #3)
No isolation of data is needed because this is EXACTLY the data I need, of people going from origin to destination for work! It is just that they are counterfactuals, and that they used 2011 MSOA boundaries instead of 2021, so I needed to source for 2011 MSOA-LAD lookup to aggregate them. I want to compare BOTH the counterfactuals assuming pre-COVID travel patterns (Potential #2) and during COVID travel patterns (Potential #3).Just Eyeballing
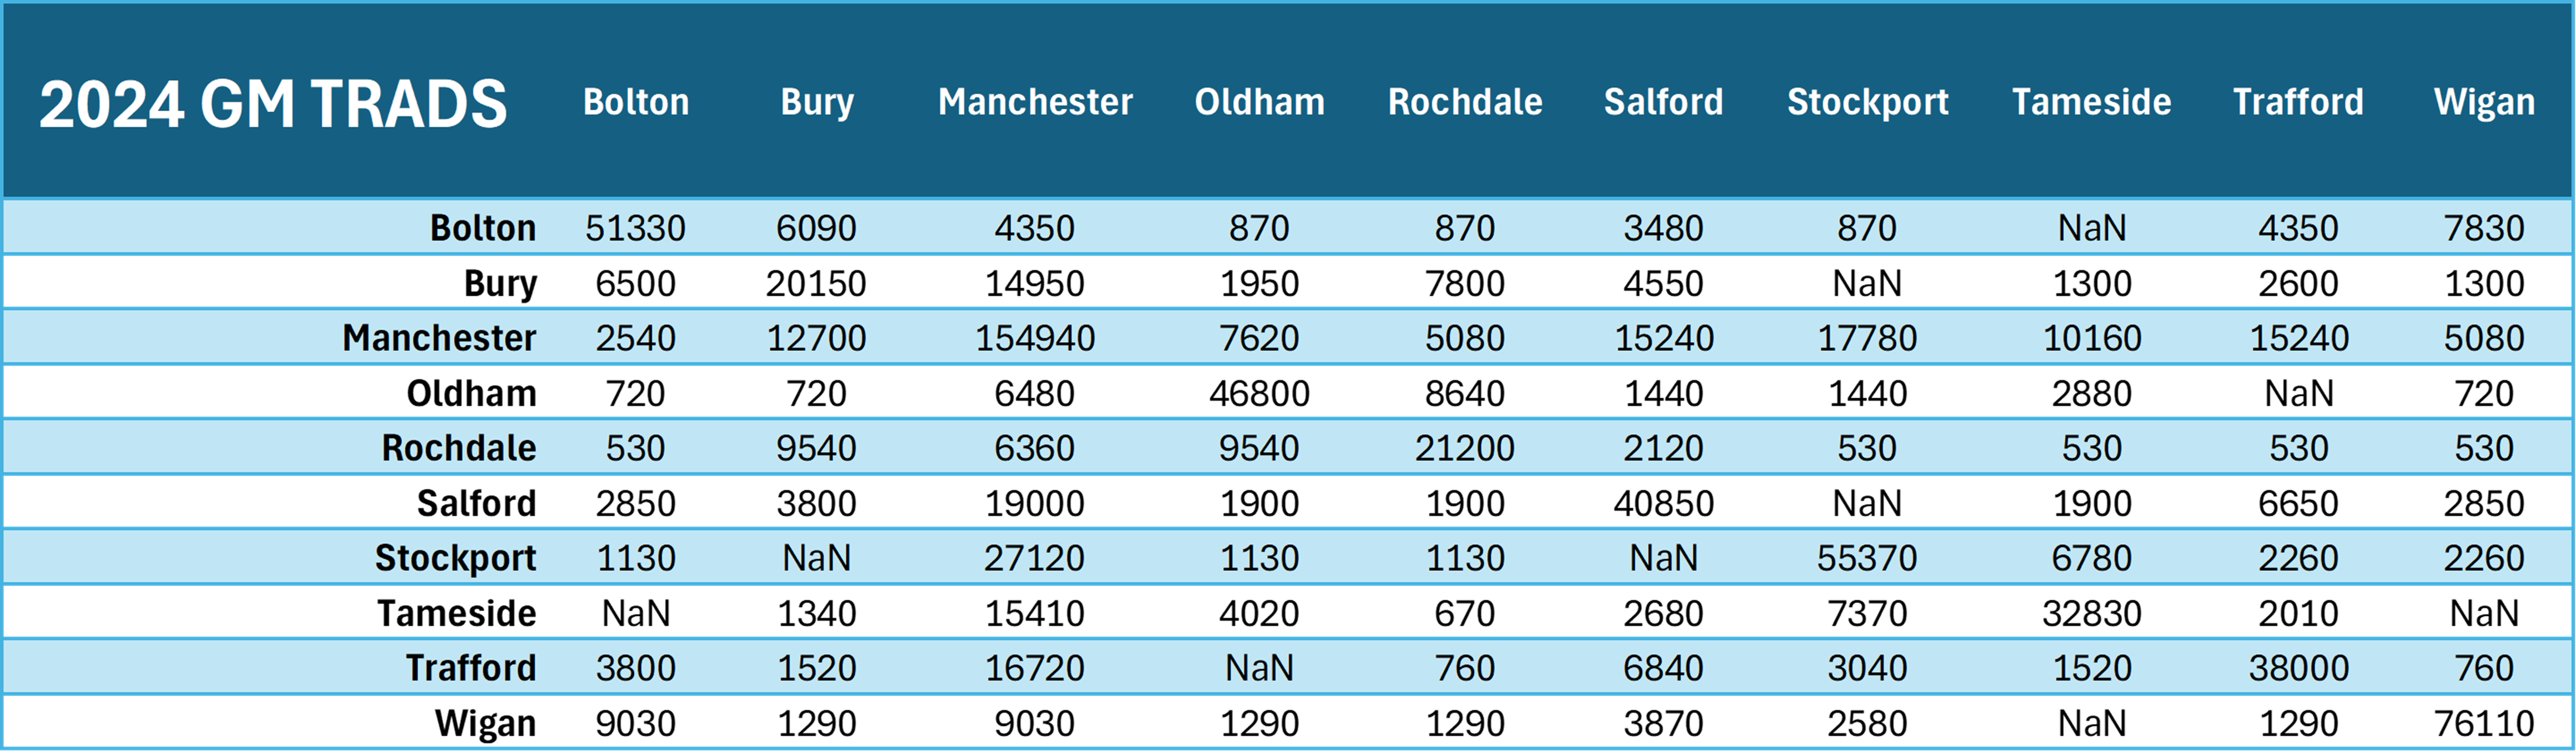 The 'gold standard' of flows between across Local Authorities in Greater Manchester based on 2024 TRADS
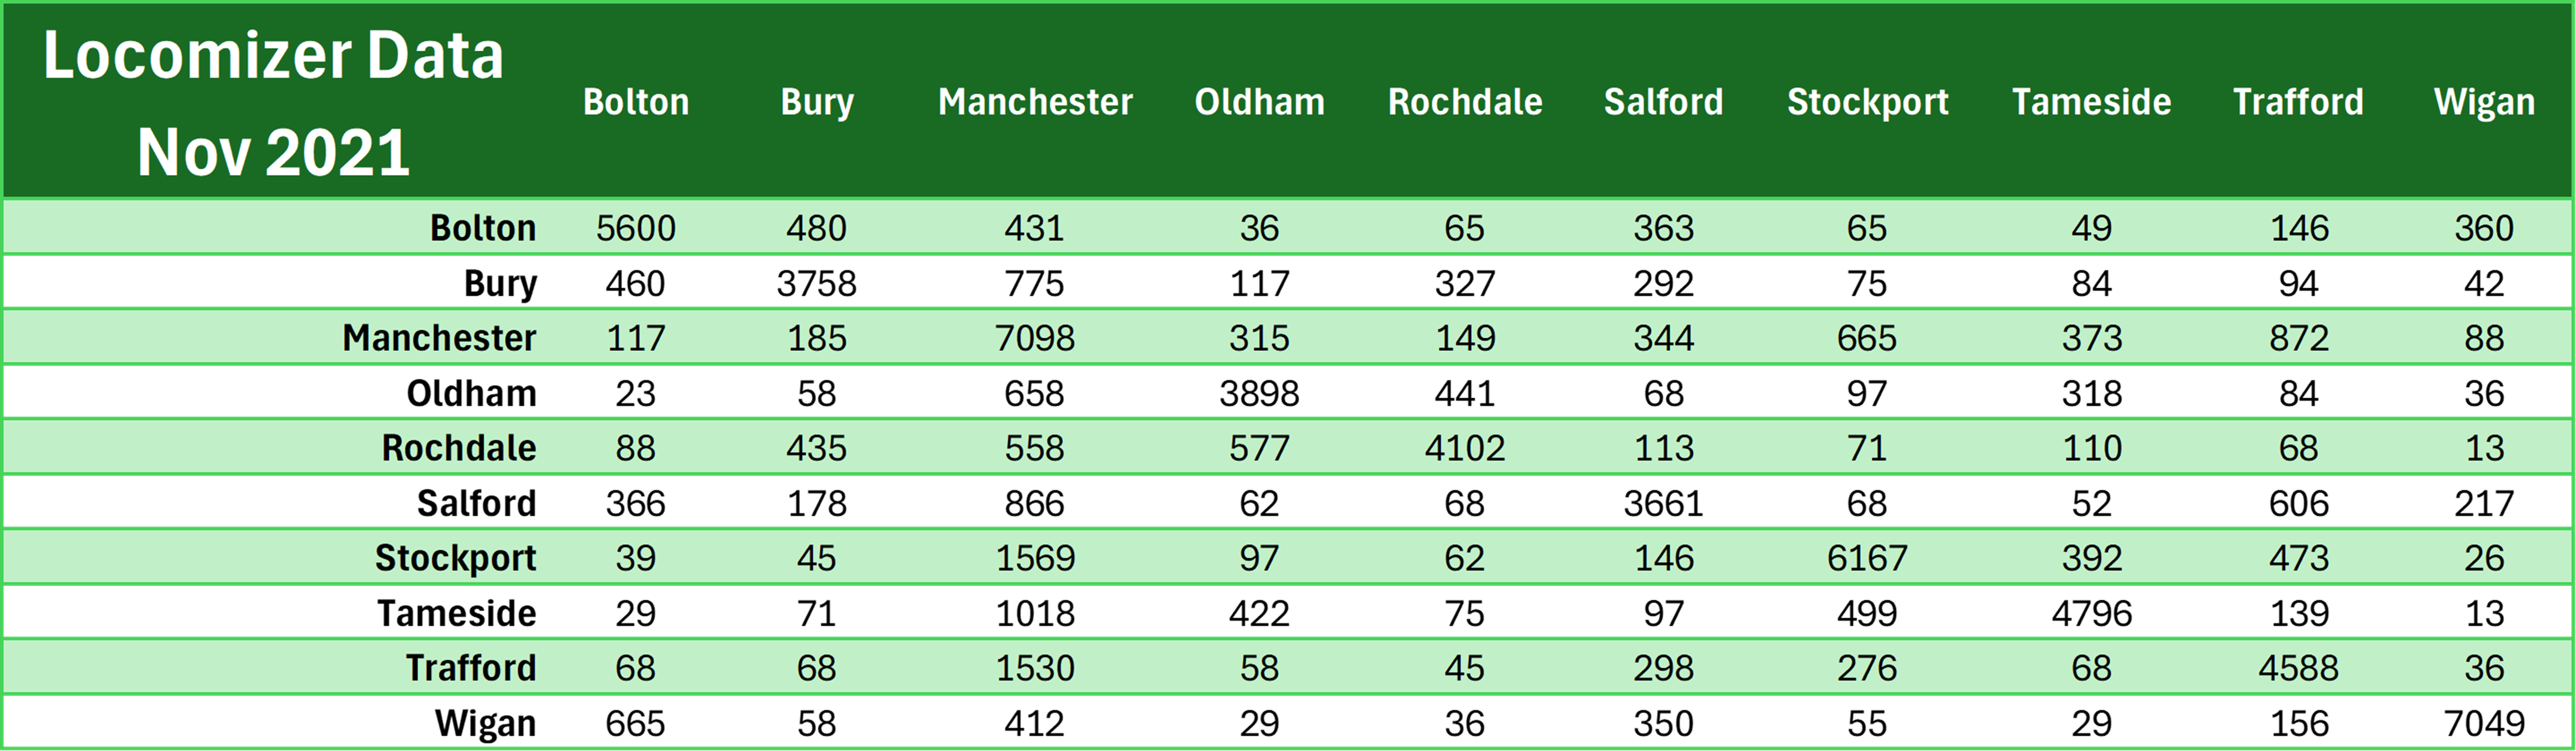 Potential #1: Locomizer Mobile Phone Data
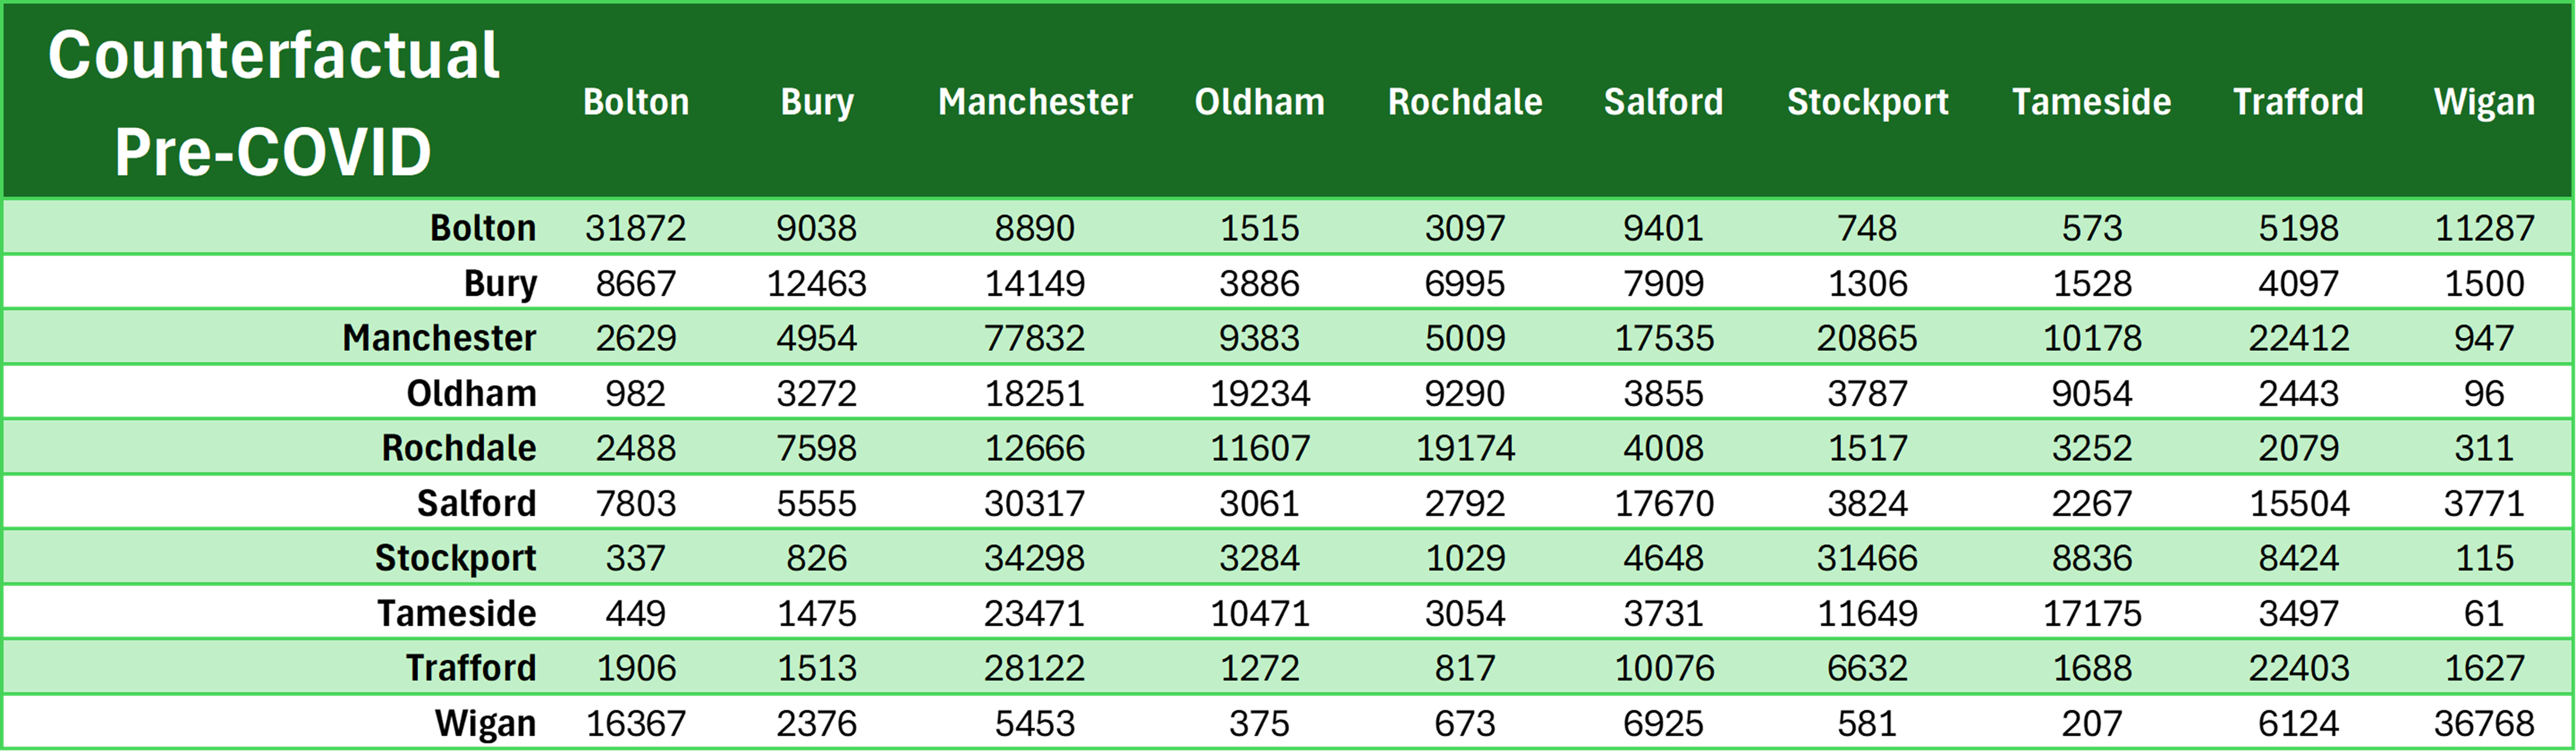 Potential #2: Counterfactual assuming Pre-COVID Travel Patterns
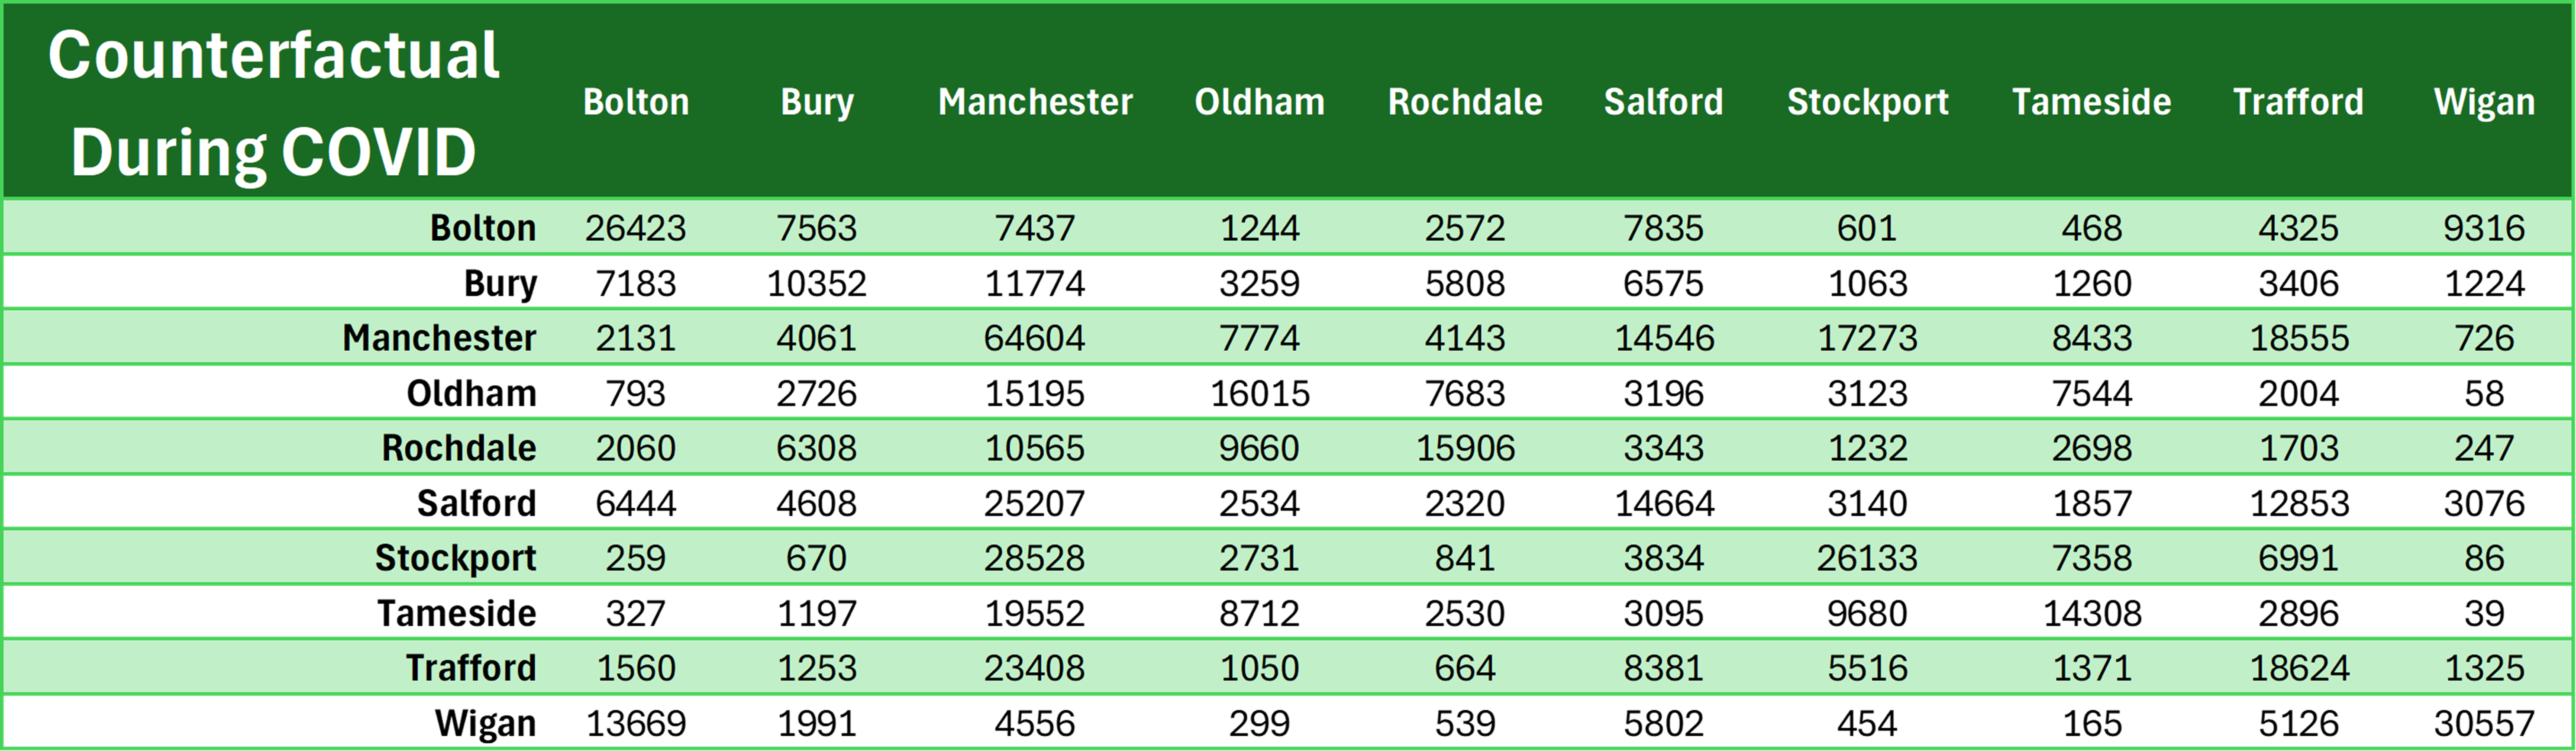 Potential #3: Counterfactual assuming During COVID Travel Patterns
Right off the bat, we see that Potential #1 is the worst because after transformation (expanding the data to cover England's population, and then
dividing by 30 days), the flow values are like 10 times less than the 'gold standard' or the other two potential datasets...
Statistical Measures
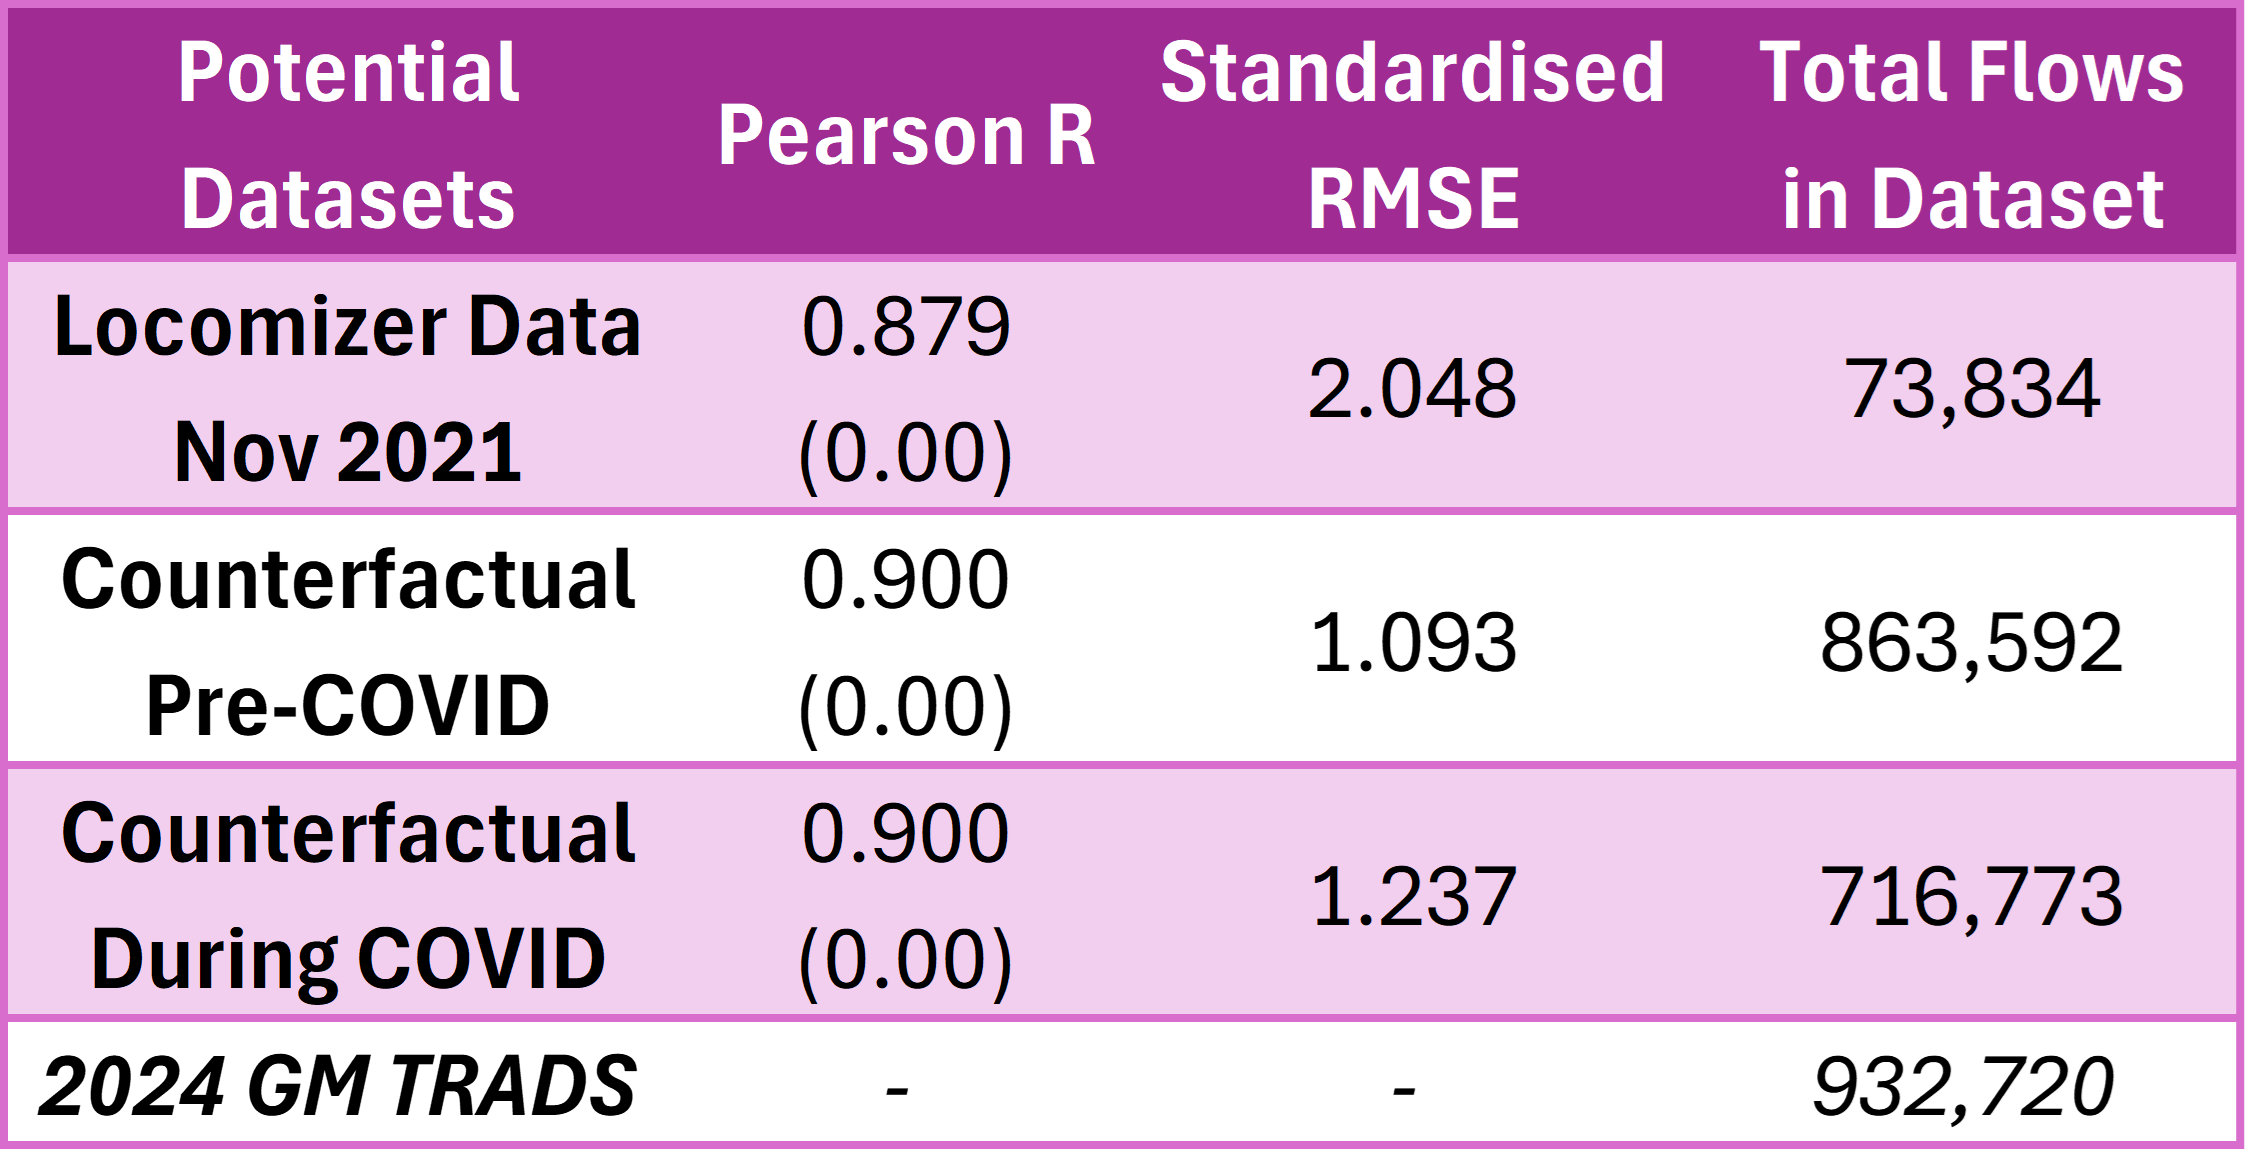
Results of Pearson Correlation Coefficient and Standardised RMSE between the 'gold standard' and potential datasets
Overall, the best OD dataset at my disposal as of now is to use
Potential Dataset #2: The ONS Counterfactual 2021 TTW Data assuming pre-COVID travel patterns. Having relatively high R values for all
three potential datasets mean that all of them largely correspond with 2024 GM TRADS in identifying similar Origin-Destination LA pair/s as having a lot
of flows. What matters more here is that the Standardised RMSE values for all of them are also quite high.
For example, focusing on Potential Dataset #2 and comparing it with 2024 GM TRADS, both are correct in identifying that intra-district LA flows within
Manchester make up the highest number of flows that originated from Manchester LA (154,940 in 2024 GM TRADS, 77,832 in Potential Dataset #2). However,
the former value is almost double of the latter. That is an extreme case of value divergence, since the mean size of an OD pair flow in 2024 GM TRADS
is about 10,000 (meaning that individual OD pair flows in Potential Dataset #2 is off from the corresponding value in 2024 GM TRADS by about 10,000 on
either side on average). Nevertheless, I am compelled to settle on the Potential Dataset #2 for now because the SRMSE values for the other two potential
datasets are higher. It is important to note that having access to more granular benchmark data (at MSOA level instead of LA level) is almost guaranteed
to produce very different results. It could be better because the aggregation may have introduced compounding errors, but it can also be much worse.
Having access to benchmark data for other English regions could also produce different statistical results.
This limits what I can do for my lines of enquiry in the sense that I cannot consciously report on the current situation or outcomes from potential
improvements in raw numbers alone because they are likely wildly off. However, the high R value statistic for Potential Dataset #2 means that there is
confidence in highlighting which areas of the city could be genuinely underserved because it is a high-demand place that falls within the accessibility
gap or beyond the 30/45-minutes scheduled journeys, and I can still report on improvements from various scenarios by percentages.
Choosing Potential Dataset #2 also means that the administrative boundaries for my dissertation will be based on 2011 MSOA boundaries
instead of the more recent 2021 boundaries. This is not expected to complicate my lines of enquiry and not change the material issue underpinned by my
research question since I am NOT primarily using working population totals for any of the numbers that I am reporting.
I got it wrong back on June 1. Specifically I got two things wrong.
Firstly, on that Pearson R values. The reason why it is all relatively high because it did detect the same high-flow OD pairs between 2024 GM TRADS and
all three potential datasets, and those are mostly the flows into Manchester district, where the city centre for Manchester is located. But those flows
are way too high, it dominated everything else and painted a flattering picture. I should have log-transformed the flows so that I can
evaluate the entirety of the datasets, including the smaller flows between the districts, and see if they are in agreement with what was observed in
Greater Manchester in 2024. The rule of thumb is still the same - the higher the R value, the more agreement there is between the datasets, and
therefore the better!
Secondly, the SRMSE values are slightly misleading. Yes, it indicates how far off from 2024 GM TRADS are the flows in the potential datasets.
However, by itself, it does not indicate the pattern of the errors - could the errors be uniform throughout (dataset A flows are all 10,000 off from
2024 GM TRADS flows), or could the errors happen all over the place? To do this, I should have calculated the ratio of potential dataset/GM 2024 TRADS
for each LA-LA flow and then find out the coefficient of variation of those ratios. In summary,
coefficient of variation (CV)
describes the dispersion of a variable in a way that is independent of the variable's unit. In my context, the CV will tell me if differences between
potential datasets and the 'gold standard' are largely consistent across all LA-LA flows or if they are wildly different. The rule of thumb is similar
to SRMSE - the lower the CV value, the more consistent the errors, and therefore the better!
How did I discover these errors? It was through a conversation with Claude, where I was asking about the implications of reporting
percentage changes across scenarios instead of raw numbers after doing SIM. Specifically, I was asking if it is possible to feed into the SIM the shares
of travel to city centre instead of the raw counts, and that was when Claude highlighted that it is only possible if the errors in the selected dataset
are consistent across the board. That led to the realisation that I DID NOT KNOW if this was the case, thus I asked what should be done, and therefore
the suggestion to calculate the CV. When I asked further if there was anything that I missed out in my evaluation such as Spearman's rank correlation,
that was when Claude replied that Spearman's is not necessary and I only needed to do Pearson's Correlation Coefficient on logged flows instead of on
the raw flows.
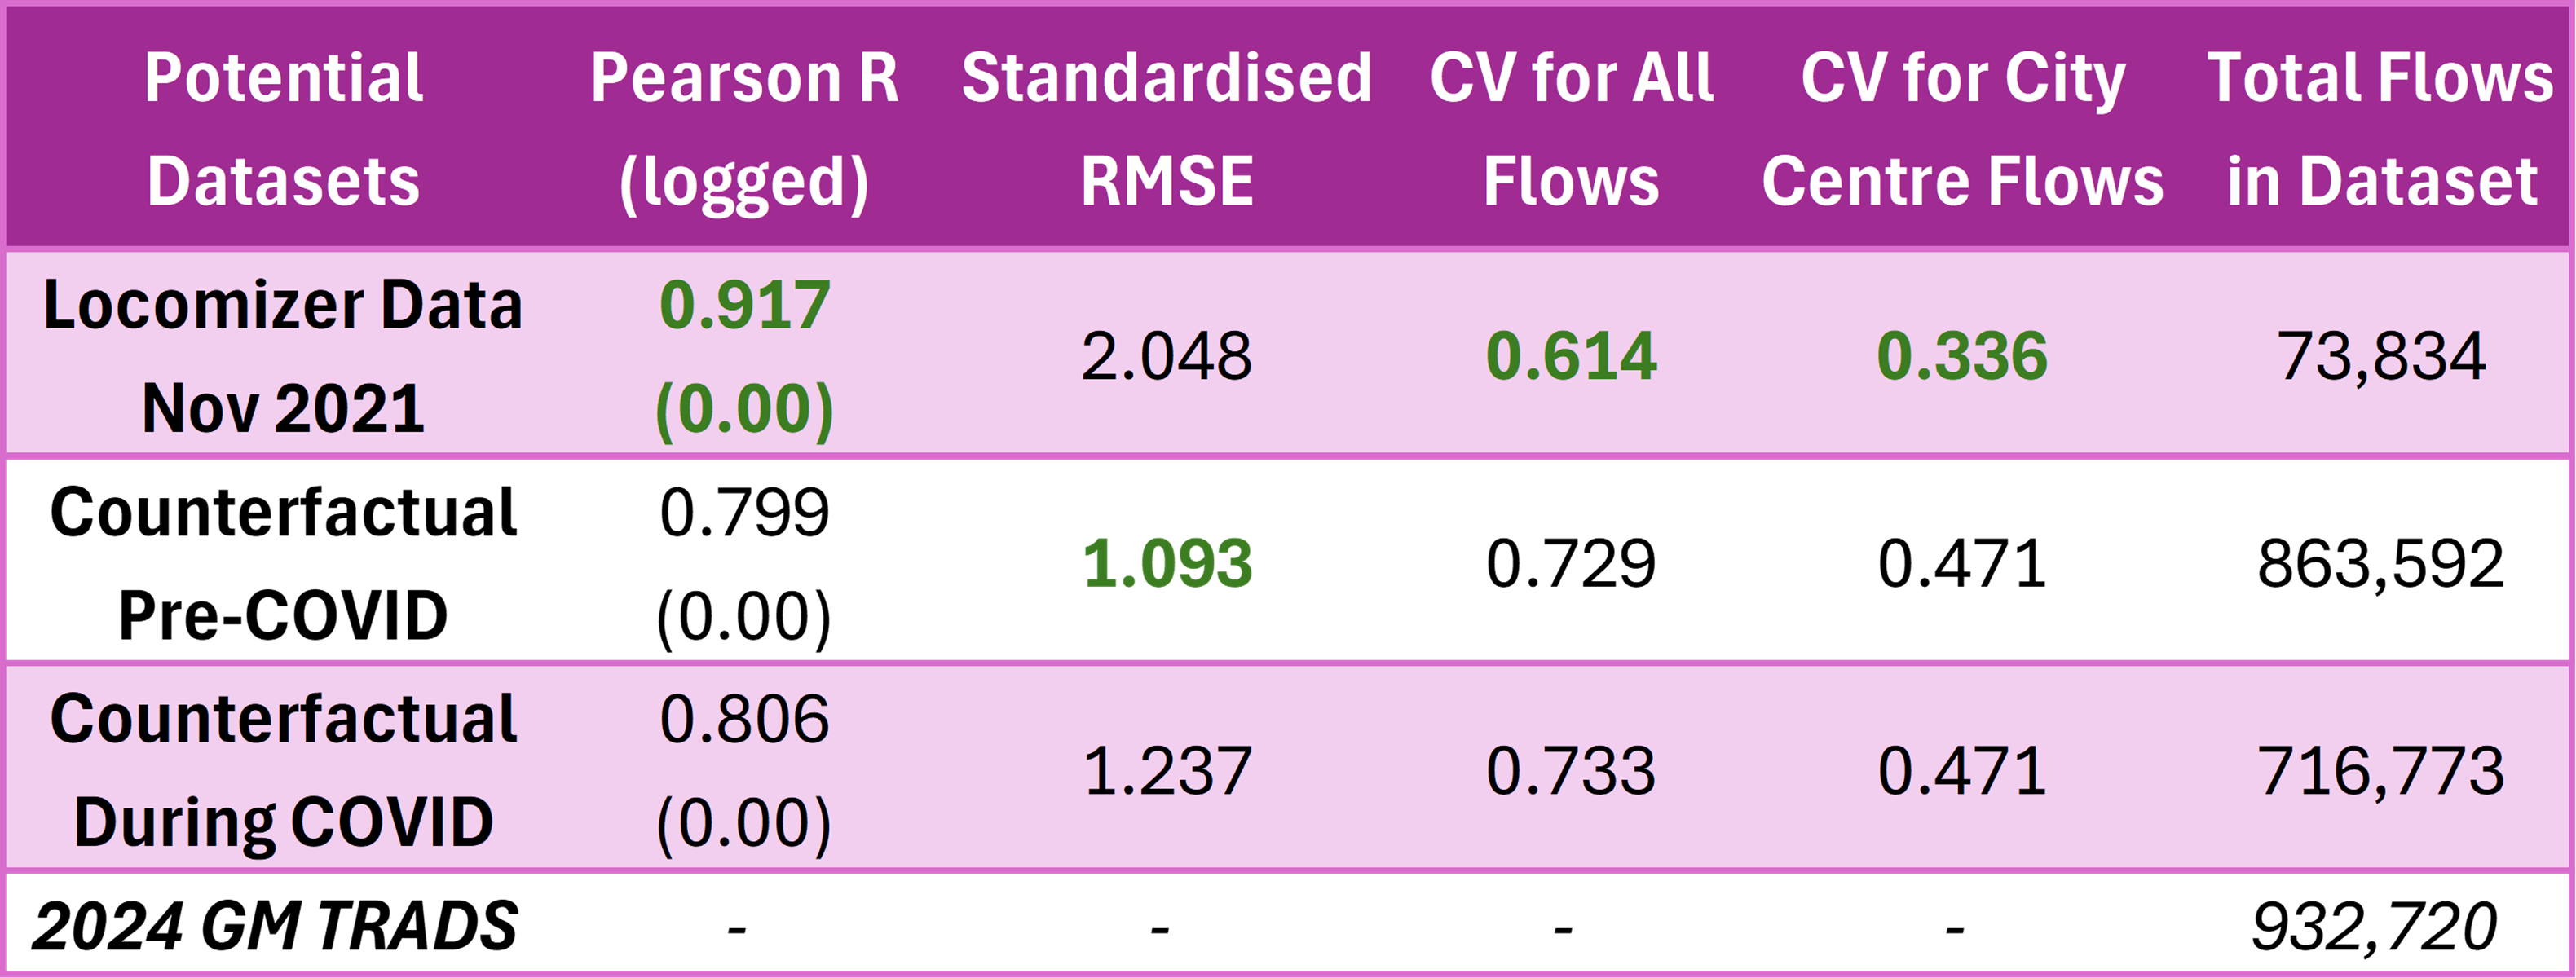
Pearson R values on logged flows and CV on error ratio between dataset and 'gold standard' are added to the comparison table
So the above table is the updated comparison table after adding the two additional statistics. The best dataset for me to use turned out to be
Potential Dataset #1: Locomizer Mobile Phone OD Data from November 2021. The R value on logged flows, while they are high for all three,
is the highest for Locomizer data. Meanwhile, both ONS counterfactuals actually saw their R values dropped when the flows are logged. That meant that
Locomizer data is in greater agreement with actual sampled post-pandemic travel patterns across Greater Manchester than the ONS counterfactuals.
The CV values also show that the Locomizer dataset is a much better fit than the other two. This is because for all flows, Locomizer's errors are
slightly more consistent than the other two datasets. The statistic is even better when we consider the CV for errors in flows to Manchester district,
where the city centre is - Locomizer data has a CV of 0.3 while ONS counterfactuals' CVs are almost 0.5. Putting this information with the SRMSE values
together paints the following picture - Locomizer dataset is very much wrong in terms of actual numbers (very high SRMSE) but as a whole it does capture
the post-pandemic travel patterns in Greater Manchester more effectively with those fewer counts than the ONS counterfactuals (lower R and CV values)!
This could be attributed to the fact that at the end of the day, Locomizer data is actual observed data from a point in time where society is
functioning closer to 2024 (the period of reduced restrictions in Nov 2021) while the ONS counterfactuals are estimates from past periods (pre-pandemic
or mid-pandemic itself).
The implication actually slightly works in my favour - Locomizer dataset is presented using the current 2021 MSOA boundaries, so that means my
dissertation's geographic unit of analysis is also based on 2021 boundaries. I have already committed since June 1 that I won't be reporting raw counts
to compare the changes between the different scenarios and baseline conditions after doing SIM (what will be reported is percentage changes instead),
so no changes on that front!